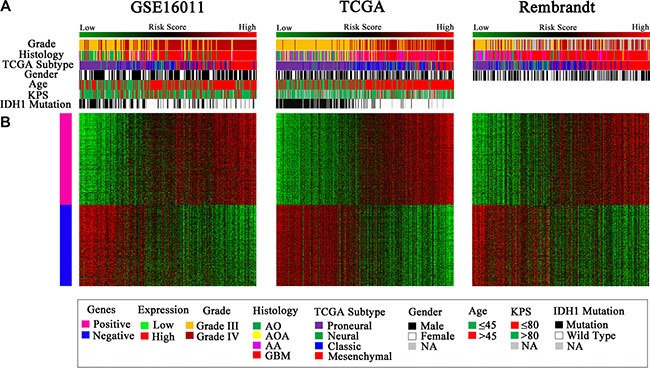
Figure 4. Distribution of molecular and clinicopathological features for HGGs and their patients aligned with the risk score in the three datasets.

(A) Tumors with high risk scores contained almost all TCGA Mesenchymal subtype and wild-type IDH1, and tumors with low risk scores included most of TCGA Proneural subtype and mutated IDH1. Grade III and IV tumors were distributed in both the low and high risk groups. (B) The differentially expressed genes were shown from the low to high risk score tumors. Pink represents the high expression of genes in the high risk group; blue represents the low expression of the genes in the high risk group.
