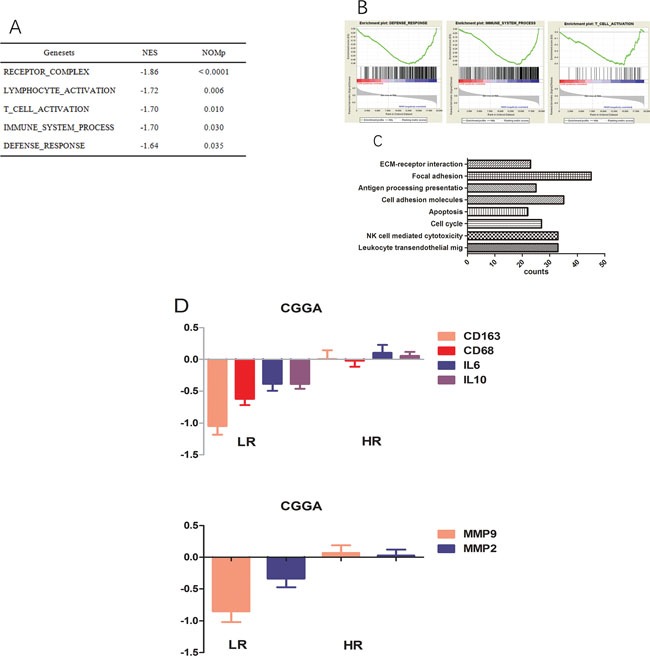
Figure 4. Functional annotation of risk groups.

A. Top five enriched pathways in the high-risk group, analysed by gene set enrichment analysis of CGGA data. B. Three representative plots of GSEA from A. C. GO analysis revealed significant associations of genes with increased expression in the high-risk group with eight main pathways. D. Genes encoding CD163, CD68, IL10, IL6, MMP2, and MMP9 are expressed at higher levels in the high-risk group.
