
Figure 4. Expression of LDHA in CaP-RR cell lines and PC-3RR xenograft model.
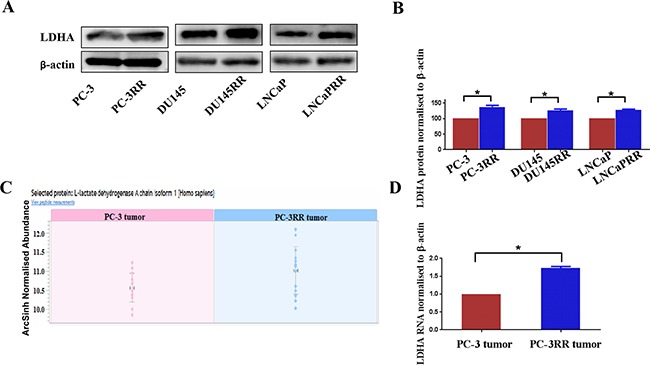
A. LDHA protein expression in CaP-RR cell lines. Higher levels of LDHA expression were seen in CaP-RR cell lines (PC-3RR, DU145-RR and LNCaP-RR) compared to their matching control cells.β-actin was used as a loading control. B. Quantification of Western blot results from CaP and CaP-RR cell lines. The results were normalized by the level of β-actin. Results are expressed as mean ± SD (n=3) (p<0.05). C. Abundance of LDHA was shown using Progenesis IQ software. D. Validation of LDHA mRNA in PC-3 and PC-3RR xenografts. LDHA mRNA levels were detected using qRT-PCR and was normalized to β-actin level. Significantly increased LDHA mRNA was associated with PC-3RR xenografts (p<0.05). “*” indicates: p<0.05.