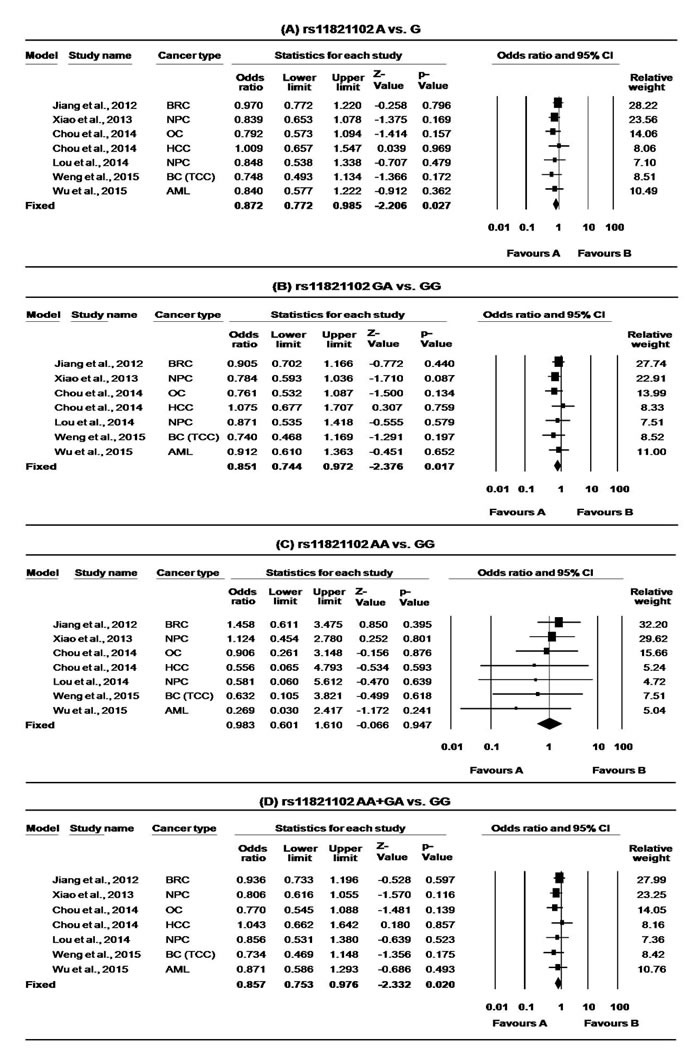
Figure 4. Forest plots for meta-analysis of CD44 rs11821102 polymorphism.

A. A vs. G, B. GA vs. GG, C. AA vs. GG and D. AA+AG vs. GG and overall cancer risk. For each study, the estimates of OR and 95% CI were plotted with square and horizontal lines. The size of the square points is the relative weight of the respective study. Diamonds indicate the pooled OR and its 95% CI.
