
Figure 3. In vitro sensitivity of human cancer cell lines to ONC201.
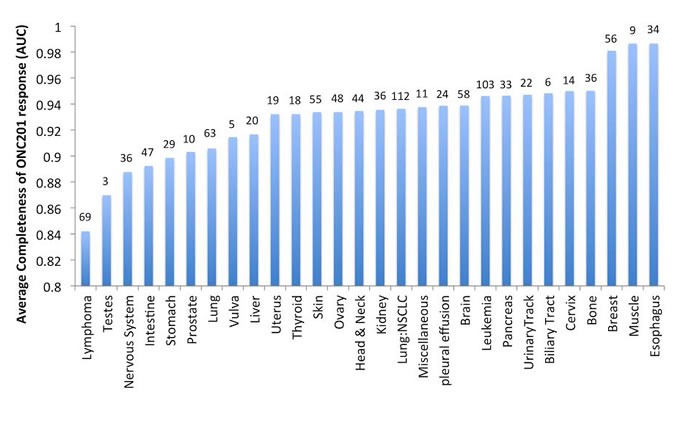
In vitro sensitivity of 1000 human cancer cell lines to ONC201 averaged and organized by tumor type. The results are shown as completeness of ONC201 response quantified as the area under the curve (AUC) in the dose-response cell viability curve averaged for all cell lines in each tumor type. Numbers above the bar indicate the number of cell lines tested per tumor type.