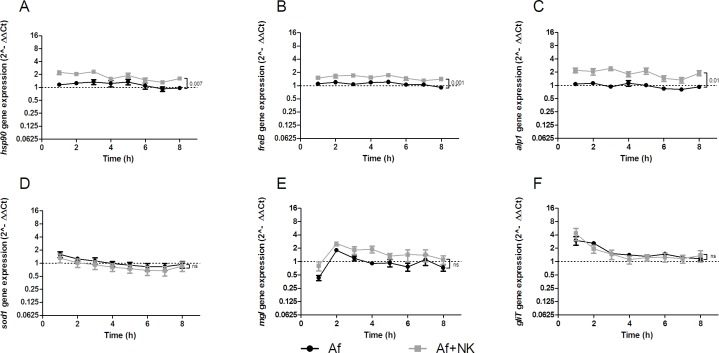
Figure 4. Gene expression profile of heat shock protein90 (hsp90).
A, ferric chelate reductase (freB) B., alkaline protease 1 (alp1) C., superoxide dismutase (sod1) D., mitogillin (mgl) E., and gliotoxin (gliT) F. assessed in A. fumigatus co-incubated with pre-stimulated human NK cells (grey squares, Af+NK), or incubated alone (black dots, Af). The X axis represents the time (hours); the first assessment of transcript levels was performed at hour 1. The Y axis represents the relative fold-change (< 1 down-regulation, > 1 up-regulation) of the gene of interest at specific time points relative to time point 0 (dotted line; < 1 down-regulation, > 1 up-regulation). Squares and dots represent means, bars the standard error of means (n = 5). The P value represents the difference at time point 8 hours.

