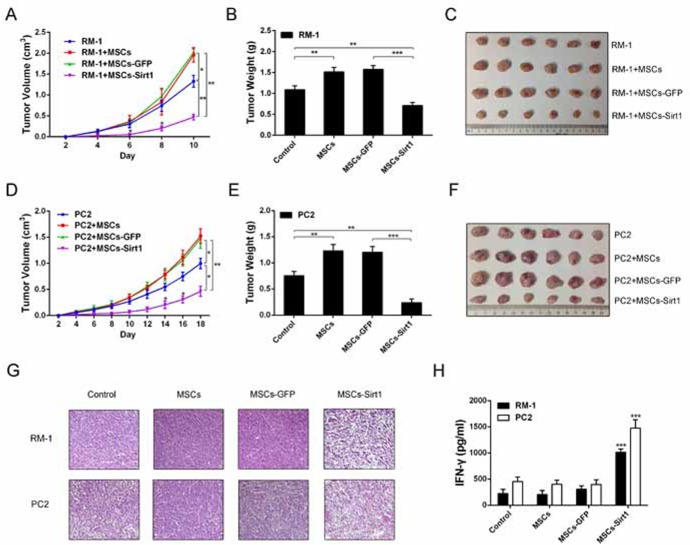
Figure 1. Effect of MSCs-Sirt1 on prostate cancer growth.
Tumor growth were detected per 2 days after subcutaneous administration with prostate cancer cells. The width and length of A. RM-1 and D. PC2 tumors were measured by calipers, then calculated the volume using the formula: volume=width2 × length × 0.5236. Tumor weights were measured after removed from mice on the B. 10th or E. 18th day. C. and F. Representive tumors were presented. G. H&E staining of tumor tissues was observed by microscope (original magnification: ×200). H. Blood samples were collected at the end of experiment, then serum inflammatory cytokines levels were determined by Bio-Plex ProTM mouse cytokine assay kit (Bio-Rad Laboratories, USA). Each group consists of 6 mice. *, p < 0.05; **, p < 0.01; ***, p < 0.001 compared with MSCs-GFP groups. MSCs-GFP, MSCs transfected GFP-Mock; MSCs-Sirt1, MSCs transfected GFP-Sirt1.

