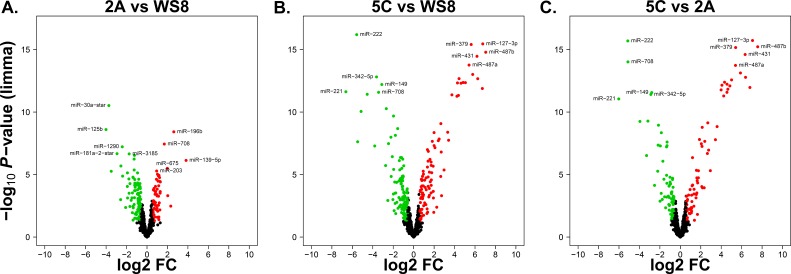
Figure 1. Volcano plots illustrating the differentially expressed miRNAs of breast cancer AI resistance cell models.
X-axes: log2 FC (fold change); Y-axes: -log10 P-value from limma analysis. miRNAs with P-value < 0.05 and FC > 1.5 are marked in red, with P-value < 0.05 and FC < 1/1.5 in green, all others in black. The top five significantly up- down-regulated miRNAs are labeled. Pairwise comparisons: A. 2A versus WS8. B. 5C versus WS8. C. 5C versus 2A.

