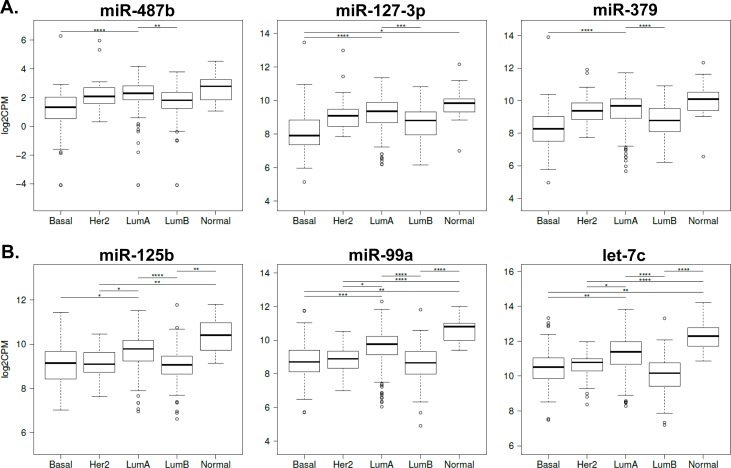
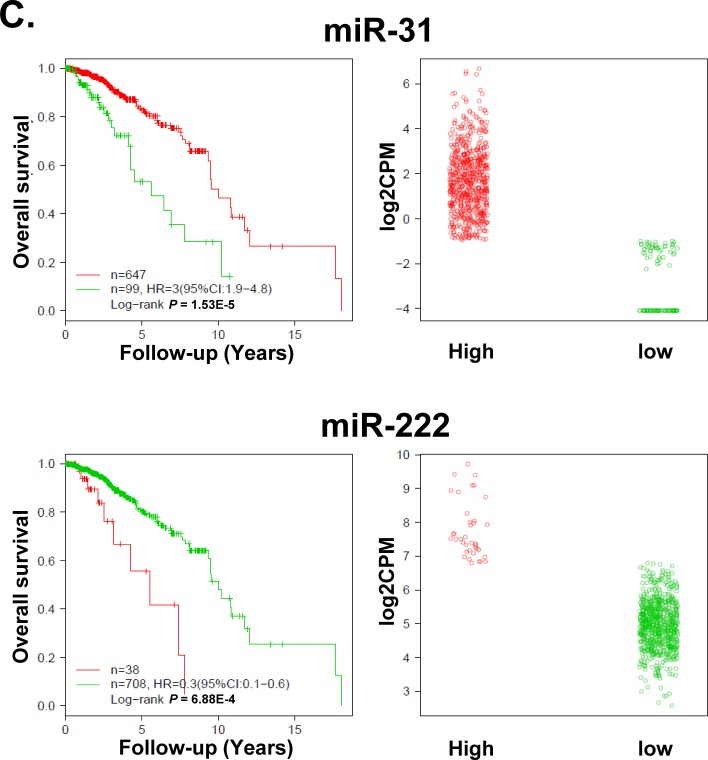
Figure 4. miRNA expression in PAM50-defined breast tumor subtypes from TCGA.
Box-Whisker plots indicate expression differences between the subgroups Basal-like (Basal, n = 86), HER2 positive (Her2, n = 43), Luminal A (LumA, n = 253), Luminal B (LumB, n = 115) and Normal breast-like (Normal, n = 16). A. Chromosome 14q32.31 miRNAs: miR-487b, miR-127-3p and miR-379. B. Chromosome 21q21.1 miRNAs: miR-125b, miR-99a and let-7c. Y-axes: log2CPM (CPM: counts per million). *: P < 0.05, **: P < 0.01, ***: P < 0.001 and ****: P < 0.0001. C. Kaplan-Meier curves for overall survival stratified by miRNA expression (n = 746). Favorable survival is associated with high miR-31 and low miR-222 expression. miRNA expression cut-offs were determined by conditional inference tree models. High (red) and low (green) expression are indicated on the log2CPM scale (CPM: counts per million).


