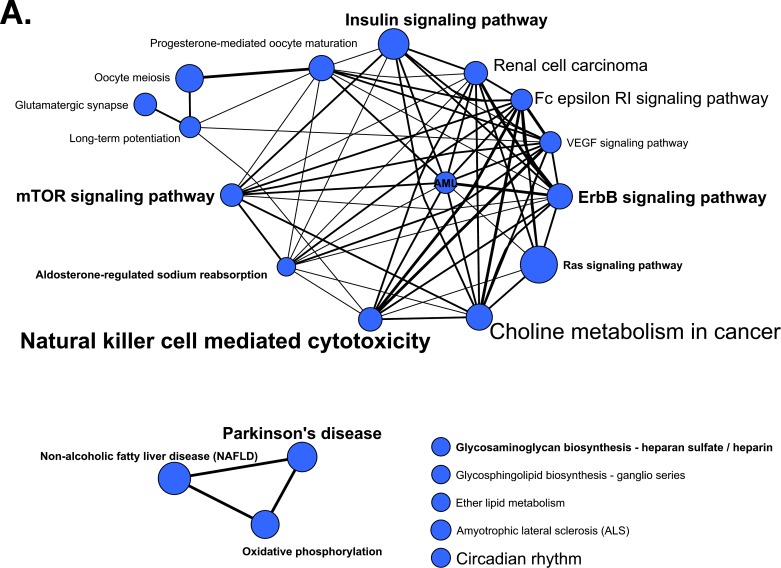
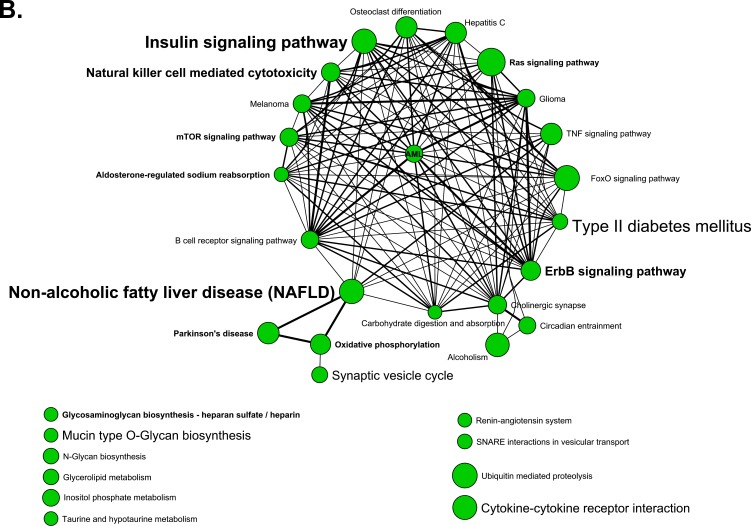
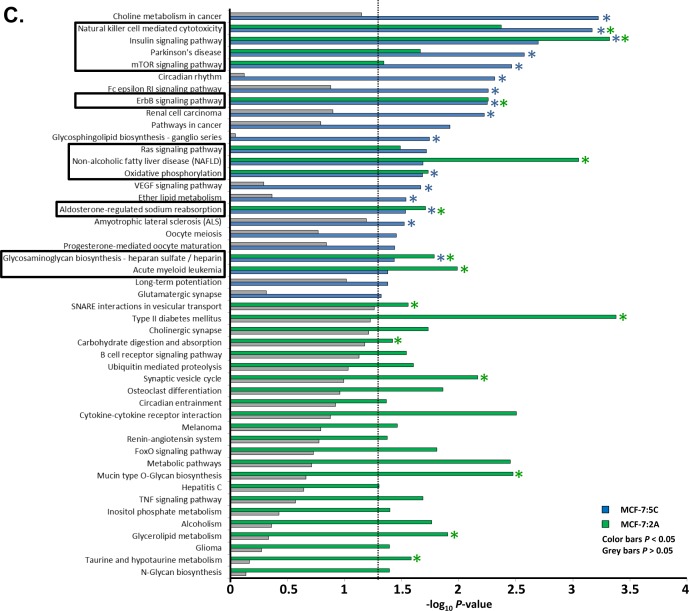
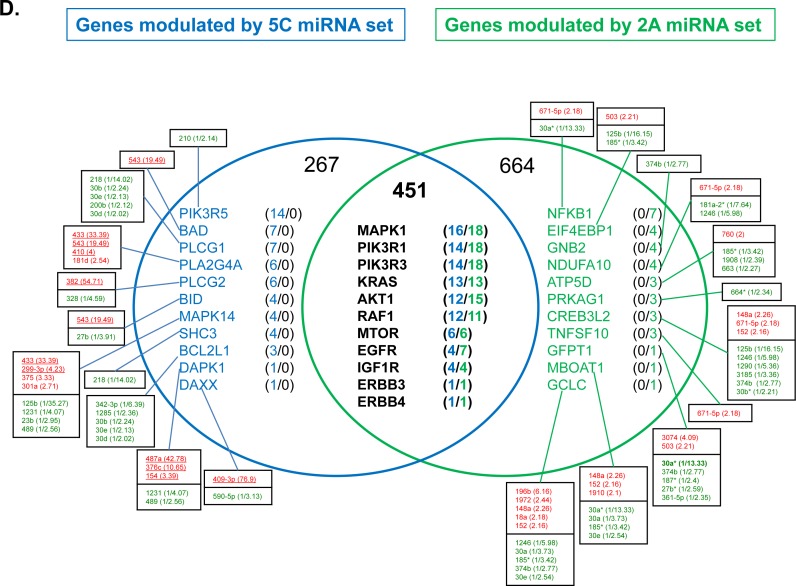
Figure 5. KEGG pathways identified in miRNA functional enrichment analyses.
Specifically enriched pathways from the entire 5C- and 2A-specific miRNA sets (Tables S1 and S2): A. 5C (blue nodes) and B. 2A (green nodes). The node size reflects the number of pathway-related genes regulated by the specific miRNA set. The edge weight illustrates the degree of gene overlap between two pathways as measured by the Jaccard index. Pathways highlighted in bold are enriched in both AI resistant cell models. The font size reflects the unadjusted Fisher test P-values from enrichment analysis (P < 0.001, large (24 pts); 0.001 ≤ P < 0.01, intermediate (18 pts); 0.01 ≤ P < 0.05, small (12 pts)). C. Enriched pathways of 5C- and 2A-specific miRNA sets. X-axes represent -log10 P-Value, Y-axes: enriched pathways sorted according to specific pathways enriched in 5C with boxed pathways being enriched in both 5C and 2A models. P-value threshold (−log10 0.05) is indicated by the dotted line. Blue and green asterisks mark enriched pathways identified with 5C- and 2A-specific miRNA sets, respectively, based on analyses using permutation tests. P-values (Fisher and permutation test) are not corrected for multiple testing. D. Venn diagram of the 5C- and 2A- specific pathway-related gene sets extracted from the respective networks (A, B). The intersection represents the total number of genes (451) modulated by both 5C-and 2A-specific miRNA sets. Sections indicate the 5C- and 2A-specific miRNA-modulated genes (5C: 267 genes, 2A: 664 genes). Examples for each subgroup are given in descending order of the number of pathways a gene was detected in both networks. miRNAs with their respective FC (Table 1A and 1B) that interact with and modulate genes in 5C- and 2A cell models are depicted in red (up-regulated) and green (down-regulated). miRNA-mRNA interaction thresholds were defined as CLIP confirmed TargetScan 7.0 in silico predictions (> 50 percentile). miRNAs of the DLK-DIO3 cluster of chromosome 14 are underlined.


