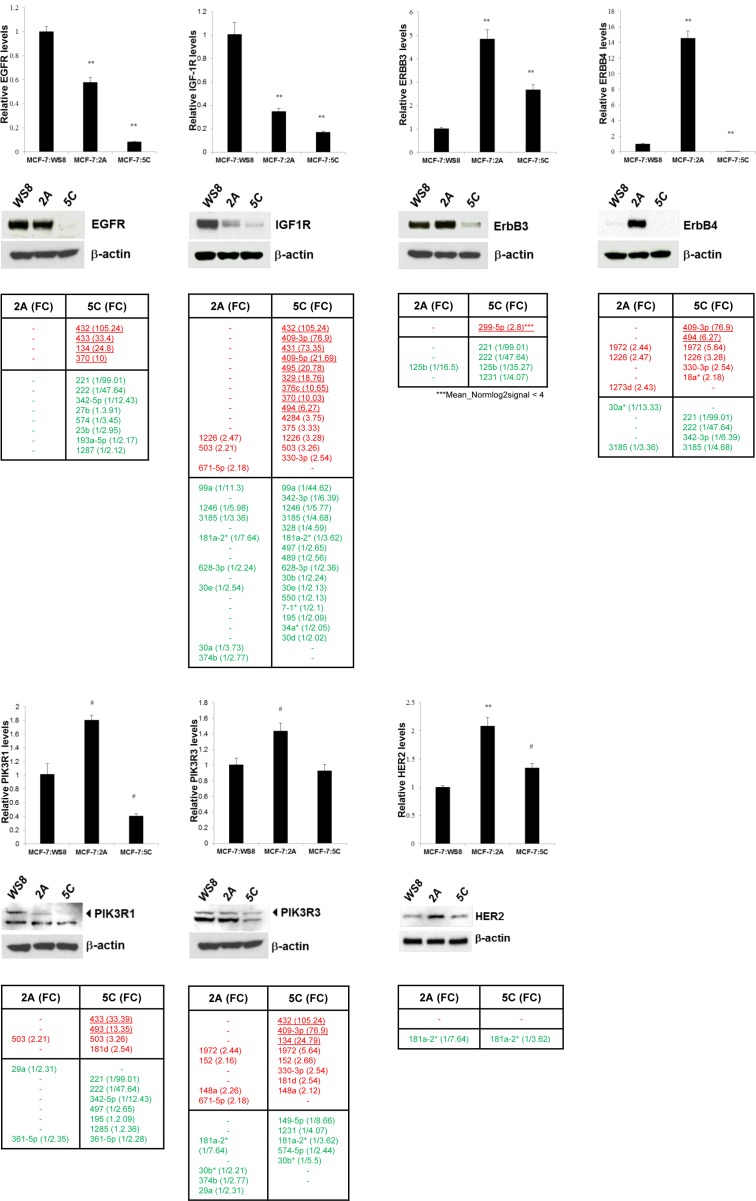
Figure 6. Basal levels of gene and protein expression of key growth regulators in AI resistance models 2A and 5C and their modulatory miRNAs.
Gene expression levels were quantified by RT-PCR and protein expression levels examined by Western blotting with ß-actin as loading control (WS8: E2 growth sensitive control). Up (red) and down (green) regulating miRNAs were obtained from specific miRNA sets given in Table 1A and 1B. miRNA-mRNA interaction thresholds were defined as CLIP confirmed TargetScan 7.0 in silico predictions (> 50 percentile). miRNAs of the DLK-DIO3 cluster of chromosome 14 are underlined. Modulatory effects towards lower protein expression in 5C as compared to 2A are shown for EGFR, ErbB3, ErbB4, IGF1R, PIK3R1, PIK3R3 and HER2. *: P < 0.05, #: P < 0.01, **: P < 0.001 (comparisons to WS8).

