
Figure 4. Effects of halofuginone and radiation on TGF-β1 signaling and EMT.
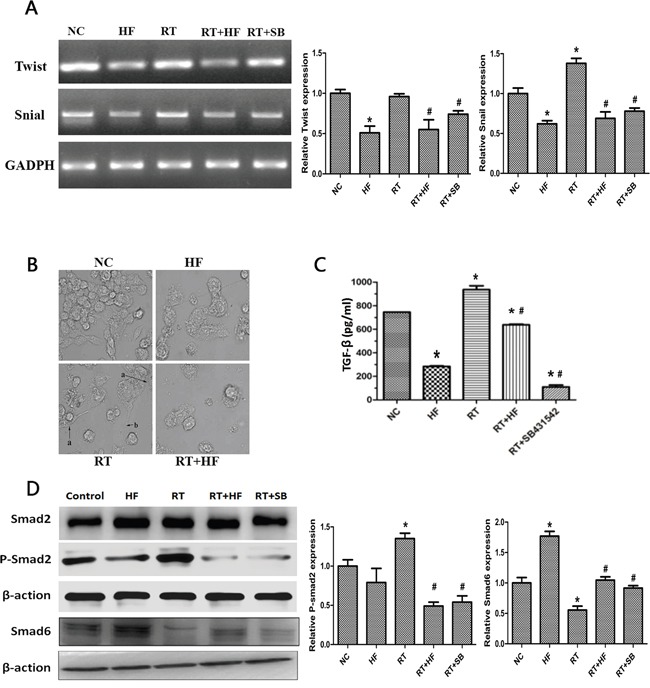
A. mRNA expression of Twist and Snail after 48h of various treatments. B. SEM images of cells subjected to various treatment. C. Representative histograms of extracellular TGF-β1 levels of various treatments quantitatively determined through ELISA assays. LLC cells were treated with different condition for 48 hours. D. Western blot analysis. Cell lysates were collected from LLC cells after indicated treatments, and analyzed for changes in expression of TGF-β1 pathway proteins, Smad2, p-Smad2, and Smad6. Actin served as a loading control. Error Bars, SD. *represents significance level with P <0.05 with respect to the NC group. # represents the level of significance with P <0.05 with respect to the RT group.