
Figure 6. Effects of halofuginone on TGF-β1 signaling in LLC xenografts.
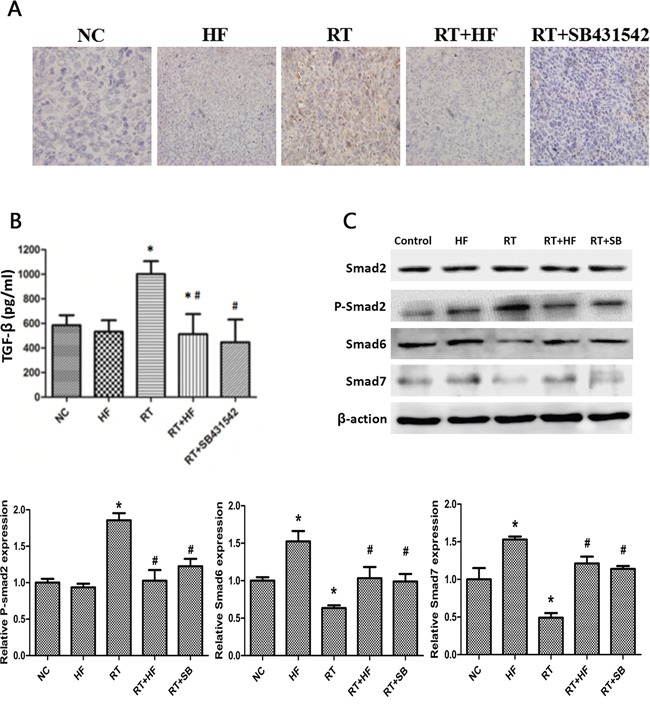
A. IHC staining: xenograft tumors tissues were collected after 14 days of indicated treatments. The expression of TGF-β1 was located in the cytoplasm or stroma, and after the IHC process, positive area turned into tan color. B. ELISA assays measure TGF-β1 levels in the tumor tissue after various treatments. Tumors tissues were collected after 14 days of treatment. C. Western blot analysis. Proteins were collected from tumor tissues after indicated treatments, and analyzed for changes in expression of TGF-β1 signal pathway markers, Smad2, p-Smad2, and Smad6 proteins. Actin served as a loading control. Tumor tissues lysates were collected from xenograft tumors tissues after 14 days of indicated treatments. Error Bars, SD. *represents significance level with P < 0.05 with respect to the NC group. # represents the level of significance with P < 0.05 with respect to the RT group.