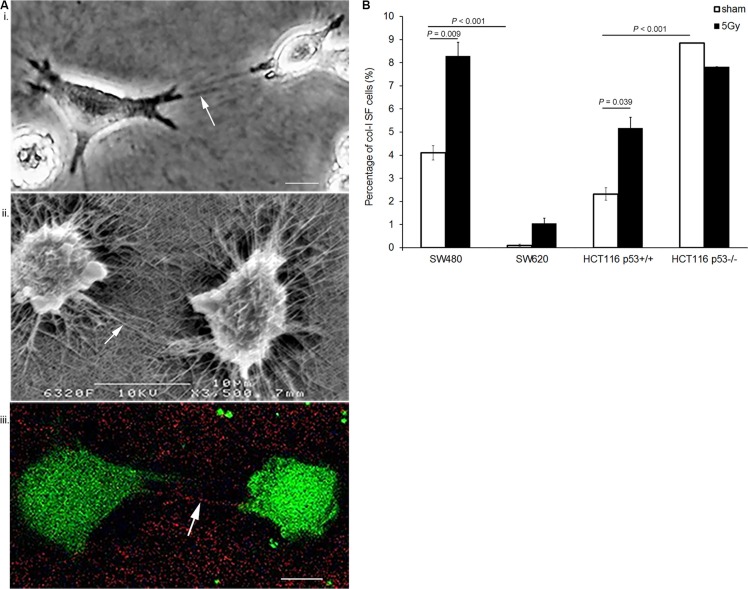
Figure 1. X-radiation enhanced col-I SF potential of various colon cancer cell lines.
(A) Visualization of col-I straps induced by SW480 cells in the col-I matrix assay: (i) phase-contrast microscopy (PCM), (ii) scanning electron microscopy (SEM), and (iii) second harmonic generation (SHG; red color) in combination with two-photon emission fluorescence (TPEF, green color). Visualization of the col-I straps by SHG confirmed the col-I specificity of the straps. (Arrows indicate col-I straps; scale bar = 10 μm). (B) Quantification of col-I SF potential of four colon cancer cell lines at day 5 after sham or 5 Gy X-radiation. Error bar represents the standard error of the mean (nIrExp = 3; t-test).

