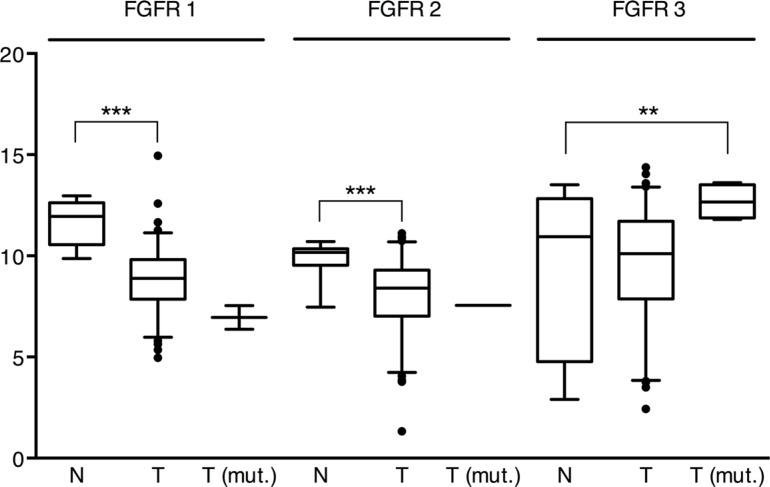
Figure 5. mRNA expression of FGFR1, 2 and 3 in the “squamous-like” bladder cancer subtype of the TCGA cohort.
Pairwise applied Welch's t-tests indicate that the average expression of FGFR1 and FGFR2 was significantly lower (p < 10−6) in non-mutated tumors (T) compared to normal tissue (N), while FGFR3 mRNA expression in mutated tumors (T(mut.)) was significantly higher (p = 0.02). ** = p < 0.01, *** = p < 0.001.

