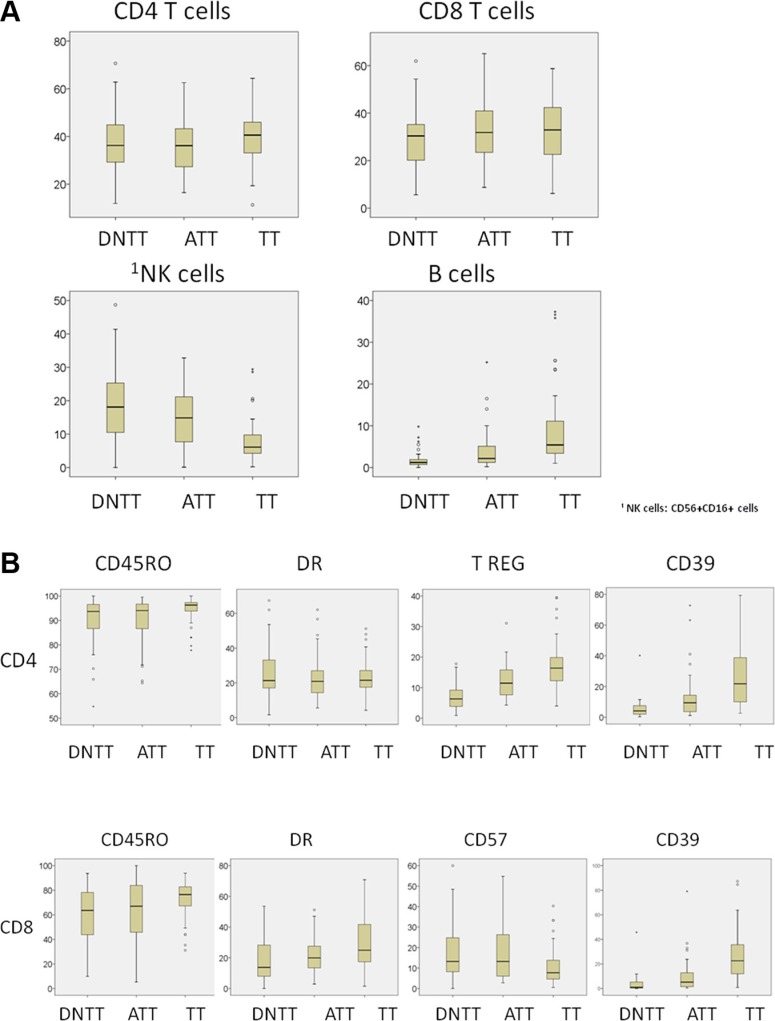
Figure 1. Analysis of immune cell density in tumor (TT), adjacent tumor (ATT), and distant non-tumor tissue (DNTT) samples from each patient.
Upper horizontal line of box plot, 75th percentile; lower horizontal line of box, 25th percentile; horizontal bar within box, median value (in %) of each subpopulation analyzed; upper horizontal bar outside box, 90th percentile; lower horizontal bar outside box, 10th percentile. Circles represent outliers.

