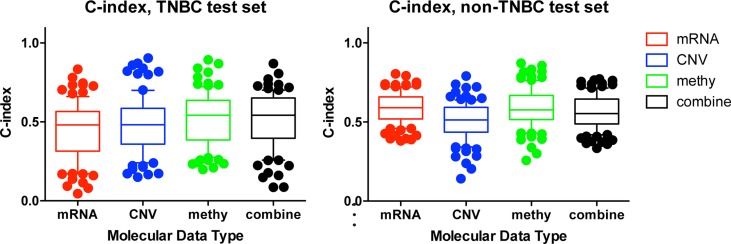
Figure 5. Comparison of the prognostic power among individual and combined molecular data types.
C-indexes of models trained from individual molecular data alone or combination of multiple data types in TNBC (a), and non-TNBC (b) distinguished with different colors. For each data type, during each of the 100 times of random splitting, 80% of the total samples were used to train the model and the remaining 20% as the test set for C-index calculations. The boxplot was plotted with the median C-index in the center and the whiskers marking the 25% and 75% percentile. The mRNA had the highest C-index in non-TNBC, while the combined molecular data had the highest C-index for TNBC. To compare the performance across different prognostic models, one tailed Wilcoxon signed rank test was used to calculate the p-value.

