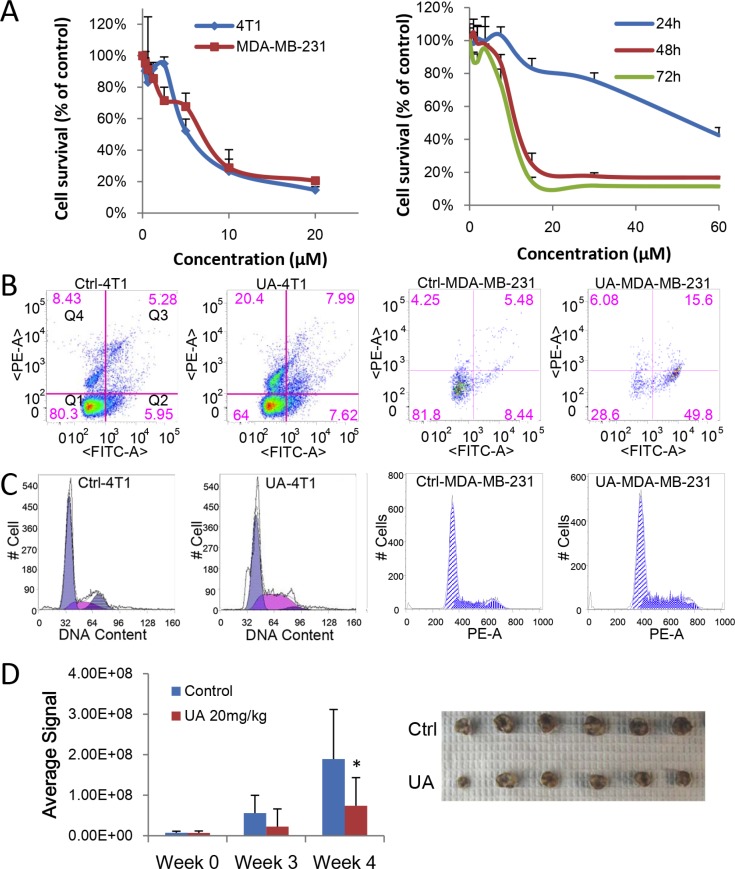
Figure 1. UA inhibits proliferation of breast cancer in vitro and in vivo.
(A) MTT assay. Left panel: 4T1 or MDA-MB-231 cells were treated with different concentration of UA for 48 hours; Right panel: MDA-MB-231 cells were treated with different concentration of UA for 24, 48 or 72 hours. (B) Cell apoptosis assay. 4T1 or MDA-MB-231 cells treated with 30 μM UA for 24 h. Cells were collect with trypsin without EDTA, labeled with Annexin V-EGFP and PI and then analyzed on flowcytometer. Dual parameter dot plot of FITC-fluorescence (x-axis) versus PI fluorescence (y-axis) has been shown in logarithmic fluorescence intensity. Quadrants: Q1 = live cells; Q2&Q3 = apoptotic cells; Q4 = necrotic cells. (C) Cell cycle analysis. 4T1 or MDA-MB-231 cells were treated with 10 μM UA for 48 h. Then cells were fixed and nuclear DNA was labeled with PI. Cell cycle distribution was analyzed by flowcytometry. Histogram display of DNA content (x-axis [PE-A]: PI-fluorescence) versus cell counts (y-axis) has been shown. (D) Left panel: Quantitative analysis of Xenogen imaging signal intensity (photons/sec/cm2/steradian) after 3 and 4 weeks treatment with UA; *P < 0.05. Right panel: UA reduced the primary tumor size (top panel, control; bottom panel, UA group). Tumor bearing mice was treated with 20 mg/kg UA and sizes of tumors derived from 4T1 cells were compared after 4 weeks.

