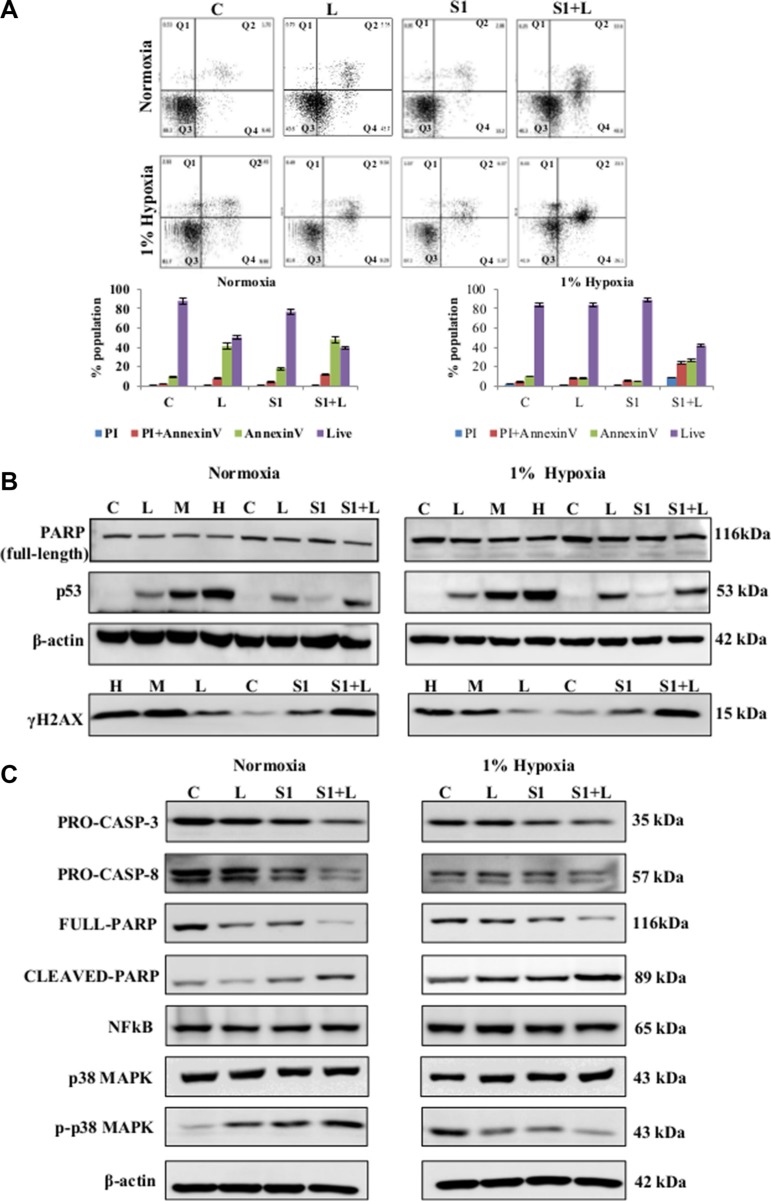
Figure 4. Molecular analysis of cell death and cell signaling markers.
(A) AnnexinV-PI dual staining and flow cytometry analysis of lung cancer cells showed elevated levels of apoptotic cell death in combination treatment in normoxia as well as hypoxia. (B) Western blot analysis for DNA damage and cell death markers shows a synergistic improvement in combination treatment compared to low dose single agent treatment. (C) Western blot analysis shows the activation of caspase-mediated apoptosis in response to combination treatment in both normoxic and hypoxic conditions. Q1=necrotic population, Q2=late phase apoptosis, Q3=live cells, Q4= early phase apoptosis. C= control, L=2μg/ml cisplatin M= 5μg/ml cisplatin, S1= 1μg/ml scriptaid.

