
Figure 1. Gene expression profiling recognizes LP-DLBCL as a core group among all DLBCL.
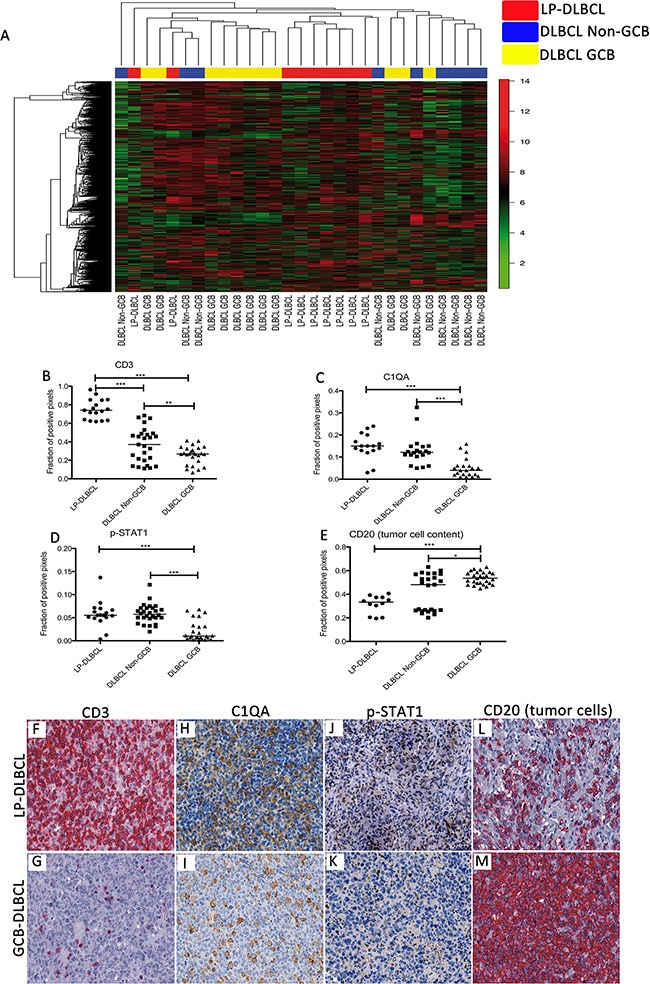
A. Unsupervised hierarchical clustering of gene expression data of LP-DLBCL (red), GCB type DLBCL (yellow) and Non-GCB type DLBCL (blue). We considered 1203 probe sets with a standard deviation > 2. B. Quantification of the fraction of CD3-positive pixels reveals significantly higher numbers in LP-DLBCL compared with Non-GCB and GCB DLBCL (***p<0.0001, **p=0.0093 paired t-test). C. Quantification of the fraction of C1QA-positive pixels reveals significantly higher numbers in LP-DLBCL compared with GCB DLBCL (***p<0.0001, Mann-Whitney-test). D. Quantification of the fraction of pSTAT1-positive pixels reveals significantly higher numbers in LP-DLBCL compared with GCB DLBCL (***p≤0.0003, Mann-Whitney-test). E. The fraction of CD20-positive pixels was significantly lower in LP-DLBCL compared with GCB type DLBCL (***p<0.0001, * p=0.0221, Mann-Whitney-test). F. Representative example of CD3 immunostaining of a LP-DLBCL (200x). G. Representative example of CD3 immunostaining of a GCB type DLBCL (200x). H. Representative example of C1QA immunostaining of a LP-DLBCL (200x). I. Representative example of C1QA immunostaining of a GCB type DLBCL (200x). J. Representative example of pSTAT1 immunostaining of a LP-DLBCL (200x). K. Representative example of pSTAT1 immunostaining of a GCB type DLBCL (200x). L. Representative example of CD20 immunostaining of a LP-DLBCL (200x). M. Representative example of CD20 immunostaining of a GCB type DLBCL (200x).