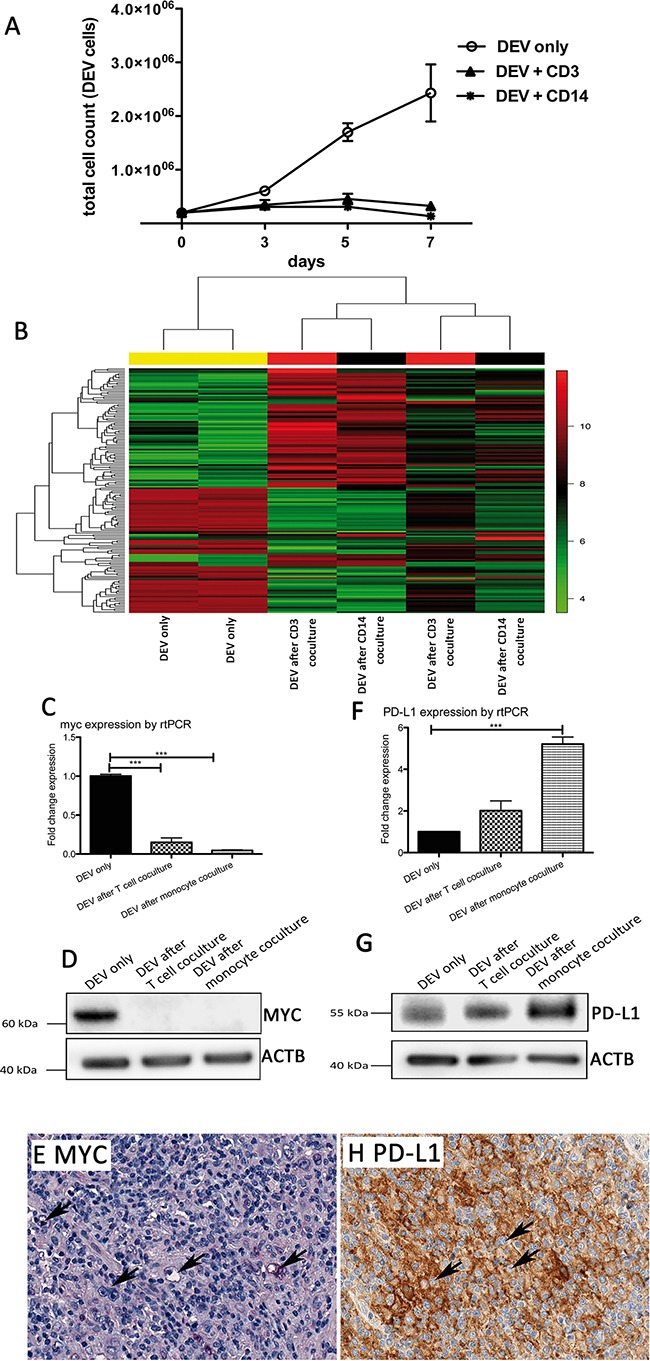
Figure 4. Growth of the NLPHL cell line DEV is impaired in the presence of T cells or monocytes.

A. Growth curves of the NLPHL cell line DEV in coculture with T cells or monocytes compared to a corresponding monoculture. B. Unsupervised GEP clustering of DEV cells in monoculture and DEV cells isolated after 5 days from coculture with T cells or monocytes. Two representative replicates of several experiments were analyzed for changes in GEP. We considered 158 probe sets with a standard deviation > 2 for the cluster analysis. C. MYC mRNA expression determined by Taqman realtime RT-PCR in DEV cells after coculture with T cells or monocytes, relative to GAPDH and relative to DEV cells from monoculture (***p<0.0001, paired t-test). D. Western blot of MYC protein in representative samples of DEV cells after coculture with T cells or monocytes compared to a corresponding monoculture. ACTB was used as loading control. E. Example of an LP-DLBCL with lack of MYC expression in the majority of the tumor cells (200x). F. CD274/PD-L1 mRNA expression determined by Taqman realtime RT-PCR in DEV cells after coculture with T cells or monocytes, relative to GAPDH and relative to DEV cells from monoculture (***p<0.0001, paired t-test). G. Western blot of PD-L1 protein in representative samples of DEV cells after coculture with T cells or monocytes compared to a corresponding monoculture. ACTB was used as loading control. H. Example of an LP-DLBCL with membrane bound CD274/PD-L1 expression in the tumor cells (200x).
