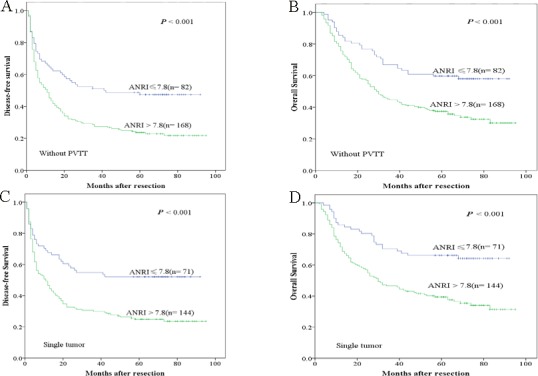
Figure 4. Kaplan-Meier survival curves of different HCC subgroups after hepatectomy.

ANRI > 7.8 significantly correlated with shorter DFS and OS in patients without PVTT A., B. and with single tumor C., D.

ANRI > 7.8 significantly correlated with shorter DFS and OS in patients without PVTT A., B. and with single tumor C., D.