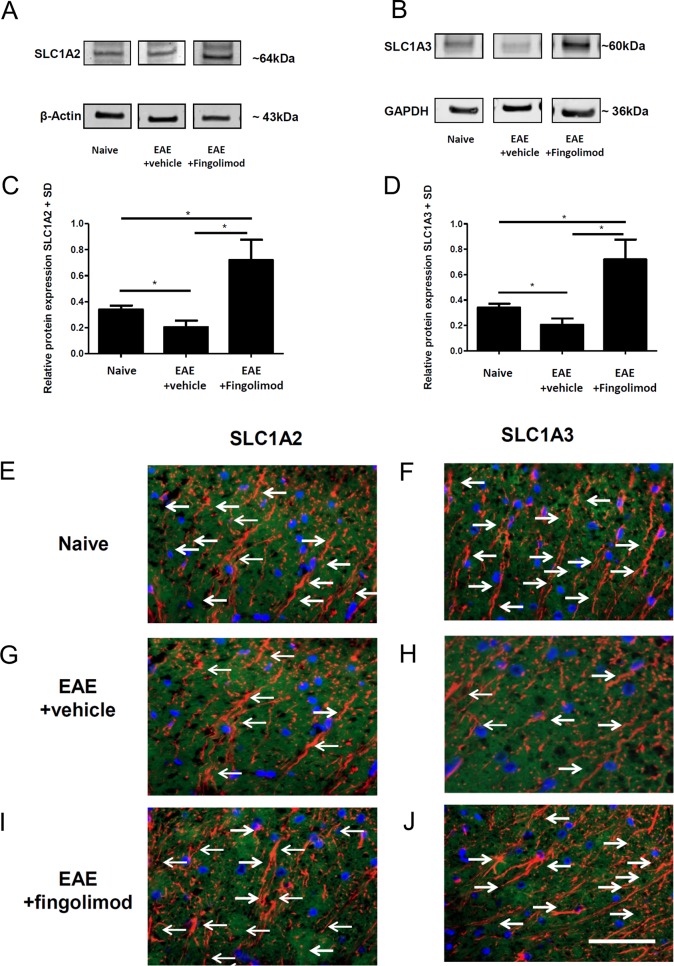
Fig 4. No effects of fingolimod on spinal cord glutamate transporter protein levels during EAE.
(A-D) Western Blot analyses of spinal cord homogenates relative to GAPDH (A) or beta actin (C) with the respective densitometry relative to the housekeeping gene (B,D). At the maximum of EAE, there was a decrease for SLC1A2 (A,B) and SLC1A3 protein levels (C,D) as compared to naïve mice which was restored after fingolimod treatment (3 mg/kg once daily). One out of three experiments is shown, n = 3 per group. (E-H) Laser scanning microscopy of spinal cord cross sections after staining for GFAP (red) and SLC1A2 (green, E,F) or SLC1A3 (green, G,H). Arrows indicate double labelled profiles. Representative images of spinal cord cross sections are shown. Bar = 50 μm.

