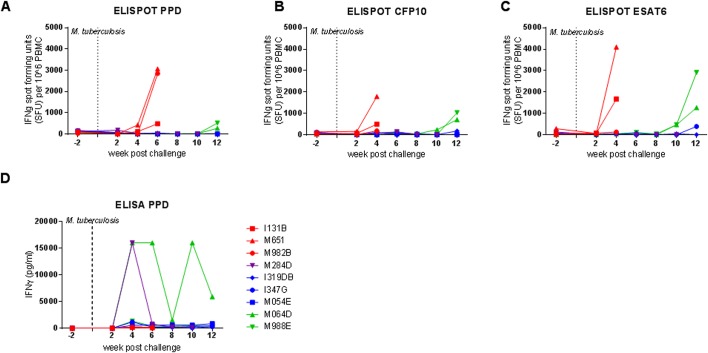
Fig 2. Immune responses after aerosol challenge with M. tuberculosis.
The frequency of Mycobacterium-specific IFN-γ secreting cells measured after challenge by ELISpot is shown in panels A (PPD), B (CFP10) and C (ESAT6). Panel D shows the profile of IFN-γ secretion by PPD-stimulated whole blood measured by ELISA. Exposure to M. tuberculosis at week 0 is indicated by the dotted line.

