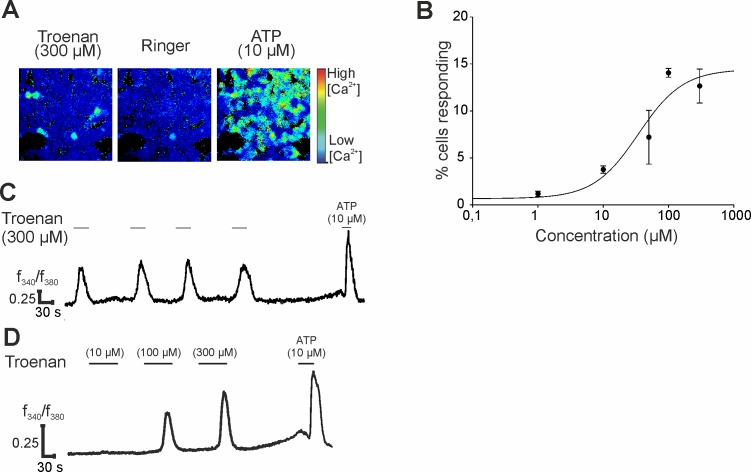
Fig 3. Characterization of Troenan-induced calcium signals in HCT116 cells.
(A) Representative image of HCT116 cells stimulated with Troenan (300 μM) in calcium imaging analysis. (B) Number of cells responding to Troenan in different concentrations. (C) Repetitive activation of HCT116 cells upon repetitive Troenan application. (D) Dose-dependent activation of HCT116 cells by Troenan. Troenan was applied at concentrations of 50 μM, 100 μM and 300 μM. Peak amplitudes show the increases in intracellular calcium concentration. To ensure viability of the cells, ATP was applied last, which serves as a positive control. N > 3 with n = 18 measurements in 9 cell culture dishes with approximately 200 cells.

