
Fig 2. Leaf microstructure of PA2 and PA4.
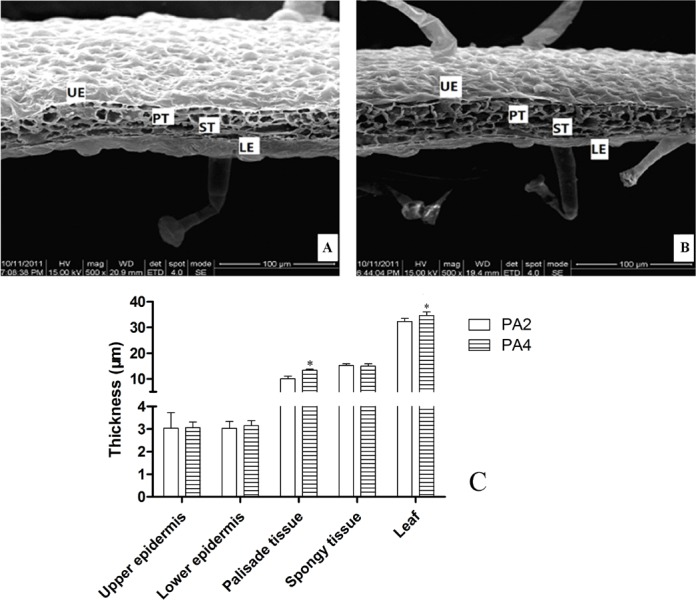
(A) leaf microstructure of PA2 (B) leaf microstructure of PA4 (C) measurents of leaf microstructure. UE, upper epidermal. LE, lower epidermal. PT, palisade tissues.ST, spongy tissues. Bar = 100 μm. The cell numbers in PA2 and PA4 are 176±8 and 140±5, respectively. The cell sizes (mean area) of PA2 and PA4 are 32.60±2.04 um2 37.21±2.04 um2. Error bars represent the standard error of the mean. *: Statistically significant differences between PA2 and PA4 (P<0.05).