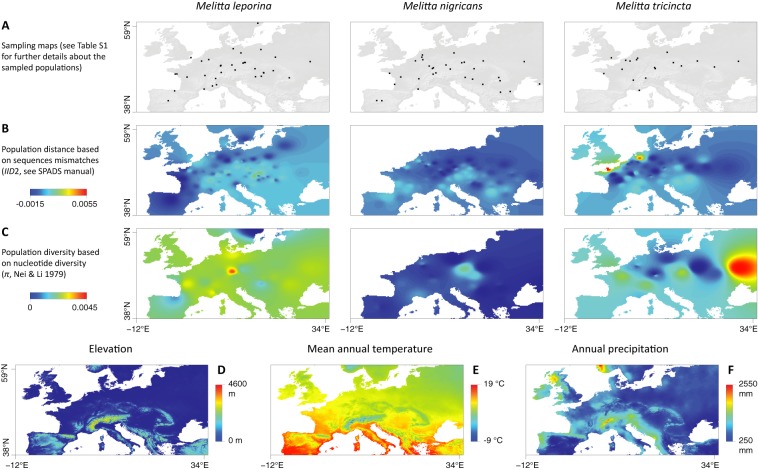
Fig 1.
Sampling map for each of the three Melitta species (A), inter-population genetic distance based on DNA sequence mismatches (IID2; B) and population nucleotide diversity (π; C) interpolation graphs generated with a distance weighting parameter a = 5, as well as maps displaying the elevation (D), mean annual temperature (E) and annual precipitation (F) on the study area. Graphs based on inter-population distances were generated with the GDisPAL function and those based on population diversity with the GDivPAL function (see the text for further details). See also Fig A-B in S1 File for the graphs generated with a = 1 and 10.

