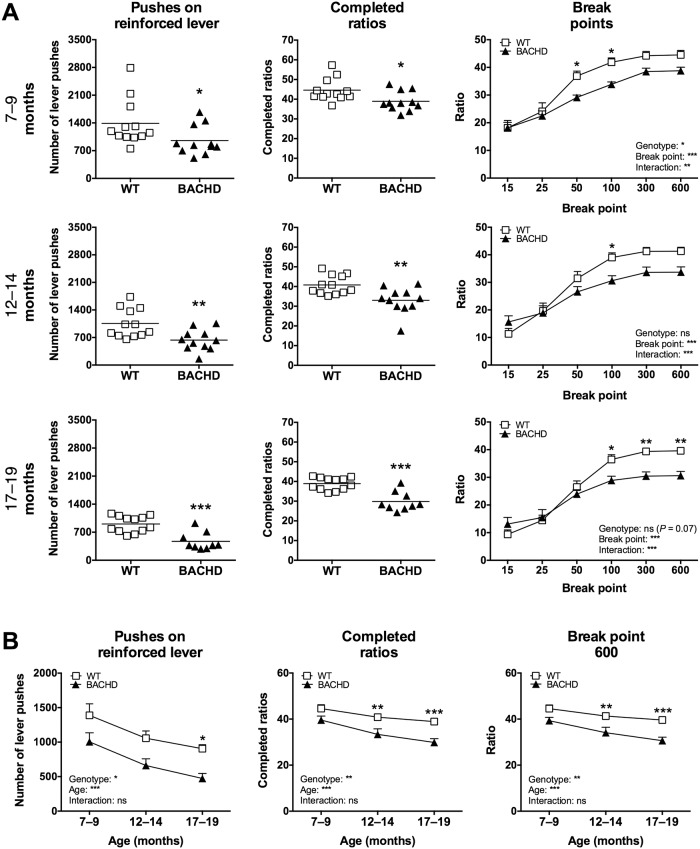
Fig 2. Primary readouts of progressive ratio performance during standard food restriction.
The graphs show the performance of Group I in the progressive ratio test, when rats were maintained on the standard food restriction protocol. (A) displays the baseline performance at the three older ages. The mean number of pushes performed on the reinforced lever and mean number of completed ratios are displayed in scatter plots, where each data point represents an individual animal's performance. The groups' mean values are also indicated. The graphs for break point analysis display the ratio where a given break point was reached, with group mean plus standard error being shown. (B) displays the age progression of the main readouts. The graphs indicate group mean plus standard error. For the scatter plots, significant results from t-test or Mann-Whitney test are shown inside the graphs. For (B) as well as for all break point graphs, repeated two-way ANOVA results are displayed inside the graphs, and results from post-hoc analysis are shown for individual data points in case significant genotype differences were detected. (P < 0.05) *, (P < 0.01) ** and (P < 0.001) ***.

