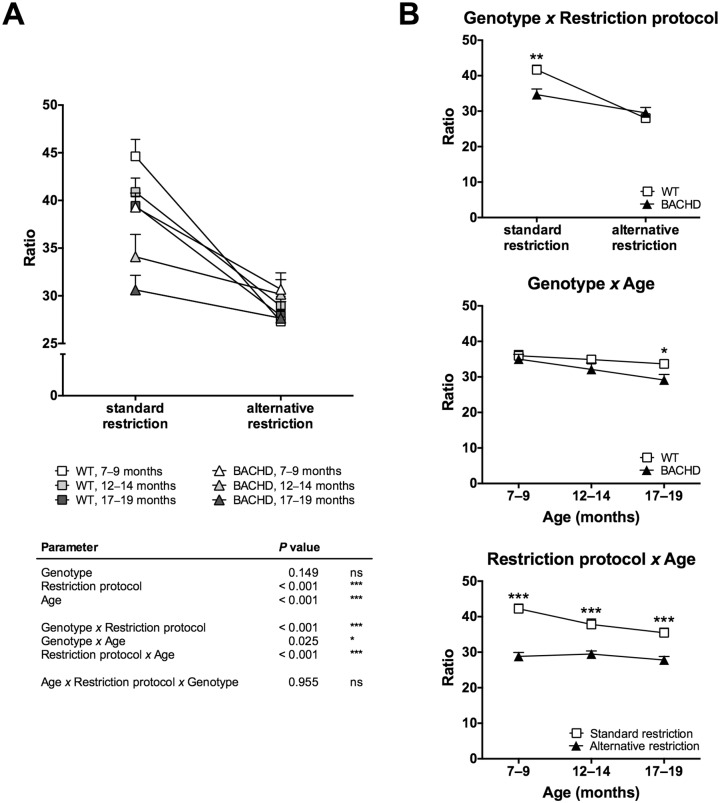
Fig 4. Three-way ANOVA analysis of break point 600.
The graphs show the results from a three-way ANOVA analysis of break point 600 for the performance baselines displayed in Figs 2 and 3. (A) displays all included data points and a summary table of the statistics. (B) displays plots for the significant two-way interaction effects. All graphs display group mean plus standard error. In (B), results from pairwise comparisons with Sidak’s multiple comparison post-hoc test are displayed for data points that differed significantly from each other. (P < 0.05) *, (P < 0.01) ** and (P < 0.001) ***.

