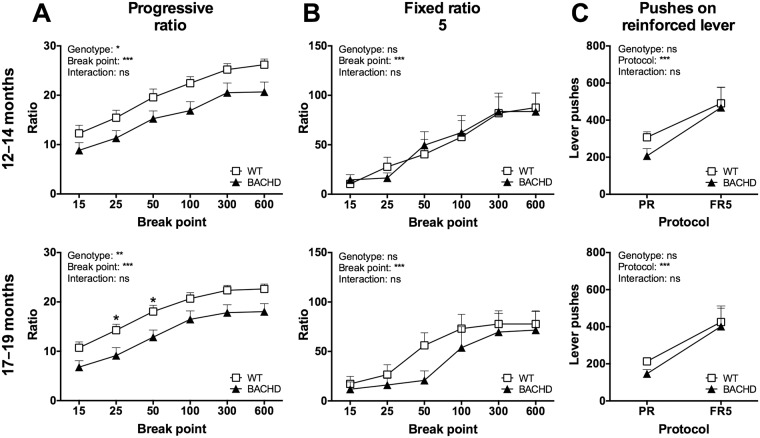
Fig 6. Progressive ratio and FR5 control test performance during satiety.
The graphs show performance of Group I in the progressive ratio and FR5 control tests when rats were maintained on free-feeding conditions. (A) shows break point analyses for progressive ratio testing at 12–14 and 17–19 months of age. (B) shows break point analyses for FR5 testing at the same ages. (C) shows comparisons of the mean number of lever pushes performed on the reinforced lever during the two test protocols. The graphs display group mean plus standard error. Repeated two-way ANOVA results are displayed above each graph, and results from post-hoc analysis are shown for individual data points in case significant genotype differences were detected. (P < 0.05) *, (P < 0.01) ** and (P < 0.001) ***.

