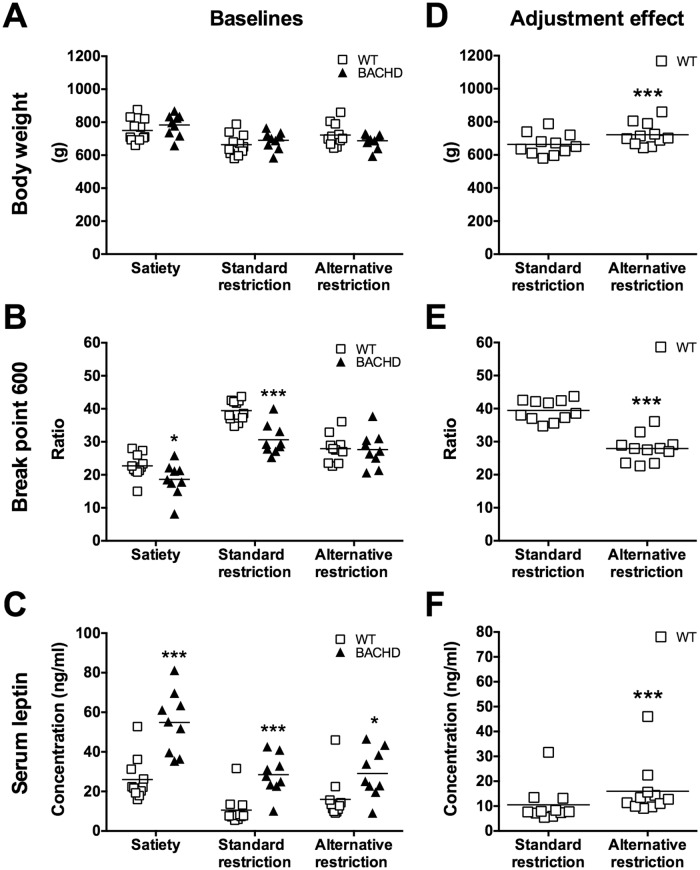
Fig 8. The effect of food restriction adjustment on body weight, progressive ratio performance and serum leptin levels.
The graphs show body weight, the number of completed ratios at break point 600 and serum leptin levels of Group I during different food restriction protocols, at 17–19 months of age. (A)–(C) show comparisons between WT and BACHD rats, while (D)–(F) show the specific comparison of WT rats before and after food restriction adjustment. The graphs indicate values from individual rats and group mean. Significant results from t-test, Mann-Whitney test, Wilcoxon test or paired t-test are displayed inside each graph. (P < 0.05) *, (P < 0.01) ** and (P < 0.001) ***.

