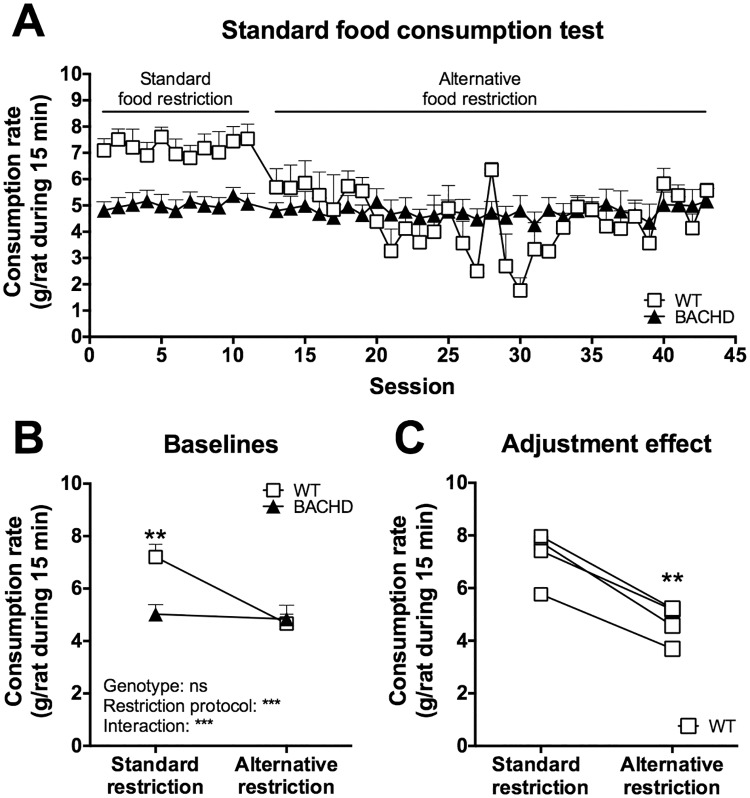
Fig 10. Food consumption rates in the standard food consumption test.
Group II's performance in the standard food consumption test at 12 months of age on standard and alternative food restriction is displayed. (A) shows the performance on individual sessions, while (B) and (C) show comparisons of baseline performance during the different food restriction protocols. In (A) and (B) the symbols indicate group mean plus standard error, in (C) the symbols indicate individual WT cages. For (B), repeated two-way ANOVA results are indicated inside the graph, and results from post-hoc analysis are displayed in case WT and BACHD differed significantly. For (C), significant results from paired t-test is indicated. (P < 0.05) *, (P < 0.01) ** and (P < 0.001) ***.

