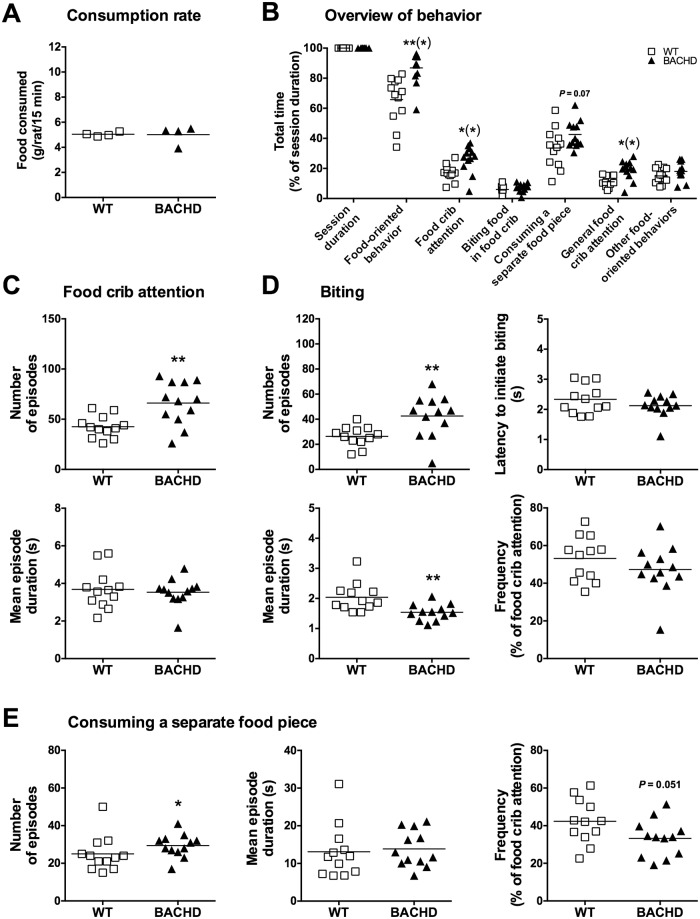
Fig 12. Video scoring of behavioral parameters from the standard food consumption test during alternative food restriction.
Group II’s performance on the standard food consumption test during the alternative food restriction protocol was subjected to detailed video analysis. (A) shows the consumption rate measured for individual cages on the video scored session. (B)–(E) display the behavior of individual rats during the same session. (B) shows the total amount of time spent on different behaviors, in relation to the duration of the test session. (C)–(E) show details concerning some of the behaviors, indicating the number of behavioral episodes, mean episode duration, frequency of behavior and the latency to initiate the behaviors. Frequency relates to the percentage of food crib attention episodes that turn into biting episodes (D) and episodes were rats consume a separate food piece (E). Significant results from t-test or Mann-Whitney tests are displayed inside each graph. (P < 0.05) *, (P < 0.01) ** and (P < 0.001) ***. Results in (B) were corrected for multiple comparisons using the Sidak method. Significance levels that were lost through this approach are indicated with a parenthesis.

