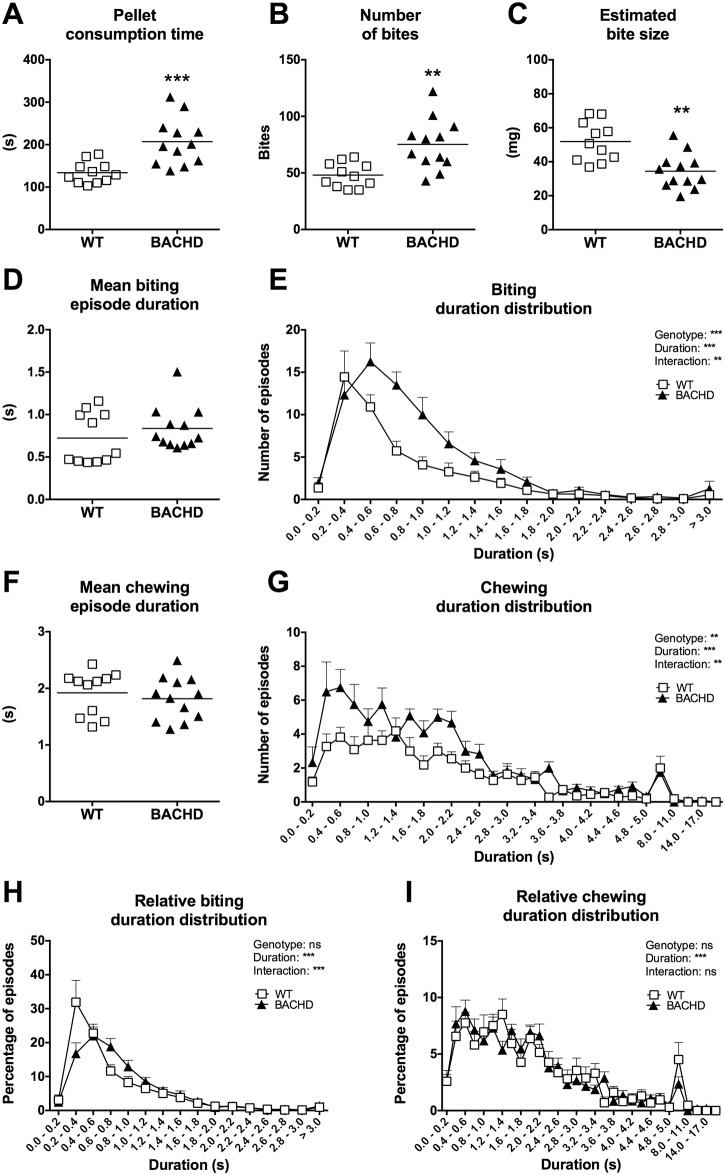
Fig 14. Video scoring of the individual food consumption test during alternative food restriction.
Group II’s performance on the first session of the individual food consumption test during the alternative food restriction protocol was subjected to detailed video analysis. (A)–(D) and (F) indicate the performance of individual rats. Significant results from t-test or Mann-Whitney test are shown. (E), (G), (H) and (I) show frequency distribution curves for biting and chewing episodes of different durations, indicating group mean plus standard error. The bins used are described in detail in the Material and Methods section. Note that the x-axis in (G) and (I) only labels every other bin. Results from repeated two-way ANOVA are displayed inside the graphs. (P < 0.05) *, (P < 0.01) ** and (P < 0.001) ***.

