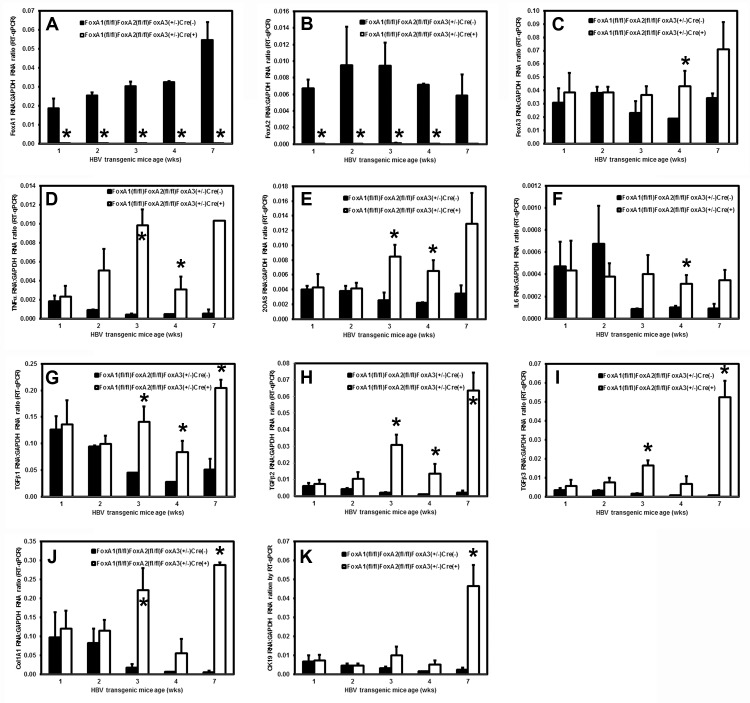
Fig 7. Effects of FoxA deletion on liver FoxA1, FoxA2, FoxA3, TNFα, 2OAS, IL6, TGFβ1, TGFβ2, TGFβ3, Col1A1 and CK19 transcript levels in 1, 2, 3, 4 and 7 week old HBV transgenic mice.
Quantitative analysis of the (A) FoxA1, (B) FoxA2, (C) FoxA3, (D) TNFα, (E) 2OAS, (F) IL6, (G) TGFβ1, (H) TGFβ2, (I) TGFβ3, (J) Col1A1 and (K) CK19 transcripts by RT-qPCR in the HBV transgenic mice. The GAPDH transcript was used as an internal control for the quantitation of the FoxA1, FoxA2, FoxA3, TNFα, 2OAS, IL6, TGFβ1, TGFβ2, TGFβ3, Col1A1 and CK19 RNAs. The mean relative FoxA1, FoxA2, FoxA3, TNFα, 2OAS, IL6, TGFβ1, TGFβ2, TGFβ3, Col1A1 and CK19 transcript levels plus standard deviations derived from FoxA-expressing (HBVFoxA1fl/flFoxA2fl/flFoxA3+/-AlbCre(-)) and FoxA-deleted (HBVFoxA1fl/flFoxA2fl/flFoxA3+/-AlbCre(+)) HBV transgenic mice is shown. The levels of the transcripts which are statistically significantly different between Cre(-) and Cre(+) HBV transgenic mice by a Student’s t-test (p<0.05) are indicated with an asterisk (*). Average number of mice per group was 3.5±1.7 (Range: 2–7).

