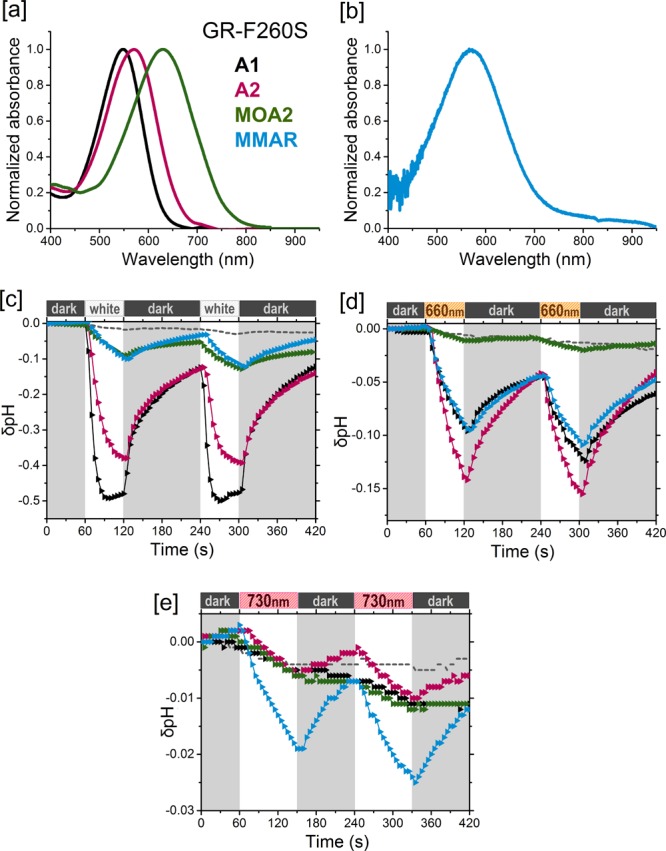
Figure 6.

Analogue pigments of GR-F260S. [a] Normalized absorbance spectra of His-tag-purified pigments in DDM containing A1 (black), A2 (pink), and MOA2 (green). [b] Hydroxylamine difference spectrum of the MMAR pigment (blue) in membrane vesicles. [c–e] Proton pumping activities of the pigments (same colors as in [a]) in starved E. coli UT5600 cells upon illumination with [c] white light, [d] a 660 nm LED, and [e] a 730 nm LED, Controls are the same as in Figure 3.
