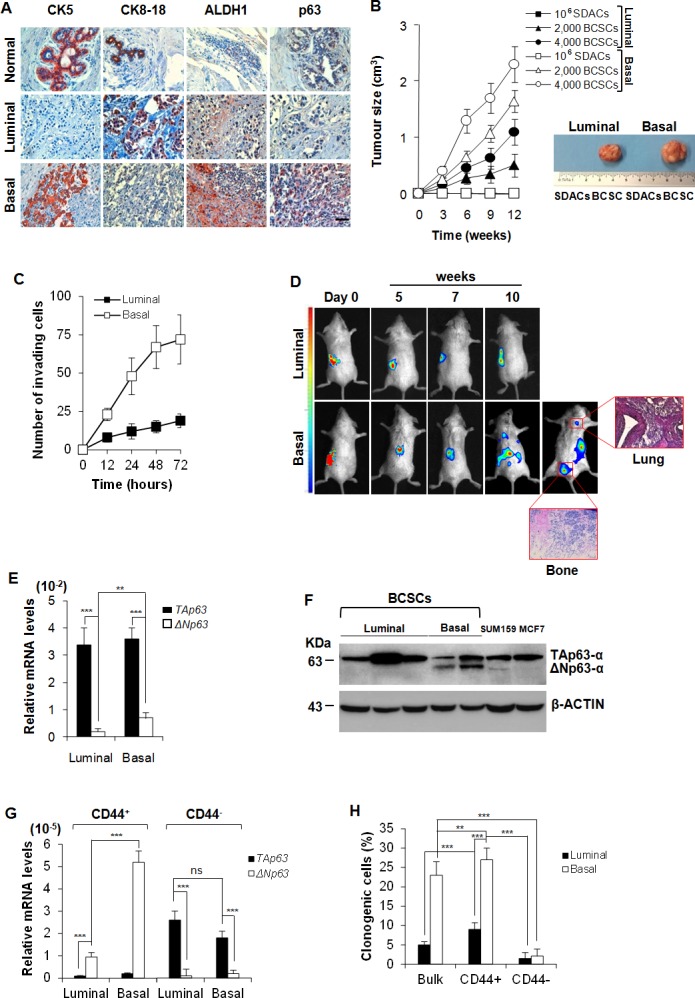
Figure 1. Basal BCSCs express ΔNp63 and retain a metastatic activity.

A. Representative immunohistochemical analysis for CK5, CK8-18, ALDH1 and p63 performed on paraffin embedded sections of 21 breast cancer clinical samples (15 luminal and 6 basal breast cancers) and 6 normal tissues. Scale bar represents 50 μm. B. Size of subcutaneous tumors generated by the injection of 106 SDACs, and 2,000 or 4,000 luminal and basal BCSCs, derived from the same patient. Data are mean ± SD of 3 independent experiments, performed with cells from 2 luminal and 2 basal different cancer patients. (Right panel) Representative gross morphology of tumors outgrowth derived by implantation of SDACs or 4,000 BCSCs derived from the same patient at 12 weeks. C. Invasion assay of 2,000 luminal and basal BCSCs cultured in SFM up to 72 hours. Results are shown as mean ± S.D. of 3 independent experiments performed in 3 luminal and 2 basal different primary cell lines. D. In vivo whole-body imaging analysis of sub-renal capsule tumors and metastasis growth at the indicated time points. Xenografts were generated injecting 4,000 BCSCs into the sub-renal capsule. Data are representative of 16 tumor xenografts generated by the injection of 2 luminal and 2 basal BCSCs derived from different patients. (Red boxes) Representative H&E analysis of lung and bone metastasis generated by injection of basal BCSCs at 10 weeks. E. TAp63 and ΔNp63 mRNA expression levels in freshly purified luminal and basal breast cancer cells. GAPDH amplification was used as endogenous control. Results show mean ± S.D. of 3 independent experiments using 5 luminal and 5 basal cancer samples. F. Immunoblot analysis for TAp63- and ΔNp63-α in luminal and basal BCSCs. SUM159 and MCF7 cell lines were used as basal and luminal control, respectively. Data are representative of 3 independent experiments using 5 BCSC lines derived from 3 luminal and 2 basal breast cancer patients. G. mRNA expression levels of TAp63 and ΔNp63 in enriched CD44+ and CD44− luminal and basal BCSCs. Data are mean ± S.D. of 3 independent experiments. (H) Clonogenic assay of bulk BCSCs, CD44+ and CD44− enriched luminal and basal BCSCs. Data are expressed as mean ± S.D. of 3 independent experiments performed with BCSCs purified from 3 luminal and 2 basal cancer patients. * indicates P < 0.05, ** indicate P < 0.01 and *** indicate P < 0.001. ns indicates non statistically significant.
