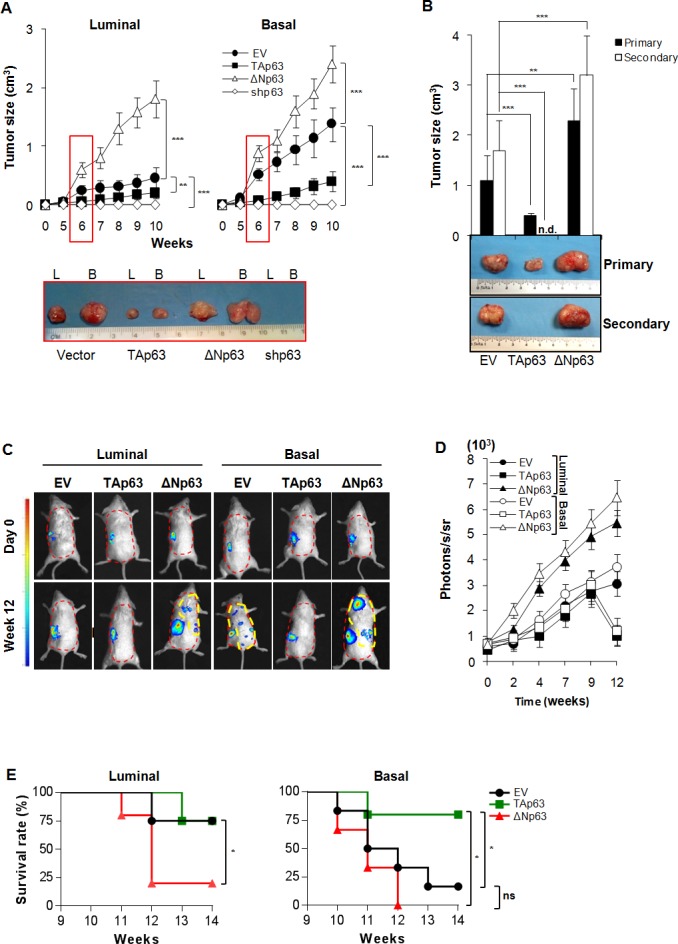
Figure 2. ΔNp63 confers metastatic potential to BCSCs.

A Size of subcutaneous tumors following injection of 4,000 luminal and basal BCSCs overexpressing TAp63, ΔNp63, or shp63 (empty vector, EV, was used as control). Data are represented as mean ± SD of 8 tumors generated by the injection of 2 luminal and 2 basal BCSCs derived from different patients. (Lower panel) Representative gross morphology of luminal (L) and basal B tumor xenografts at 6 weeks. B Size of primary (9 weeks) and secondary (6 weeks) serial transplantation of subcutaneous tumor xenografts obtained by injection of 4,000 empty vector (EV), TAp63 and ΔNp63 derived from 2 basal BCSC primary lines. n.d. indicates: no detected tumors. C In vivo imaging analysis of sub-renal capsule xenograft tumors and metastasis growth (red dashed area) at the indicated weeks derived from the injection of 4,000 luminal and basal BCSCs transduced with empty vector (EV), TAp63 and ΔNp63. D In vivo imaging kinetics analysis as in C at the indicated time points. Data represent mean ± SD of 3 independent experiments performed with 2 luminal and 2 basal BCSCs derived from different patients. E Survival rate percentage of mice treated as in C, at the indicated weeks. Results were analyzed using the log-rank test. Photons/seconds/steradian (photons/s/sr) = 4 for all the metastatic lesions (yellow dashed area) was chosen as limit to proceed with mice sacrifice. * indicates P < 0.05, ** indicate P < 0.01 and *** indicate P < 0.001. ns indicates non statistically significant.
