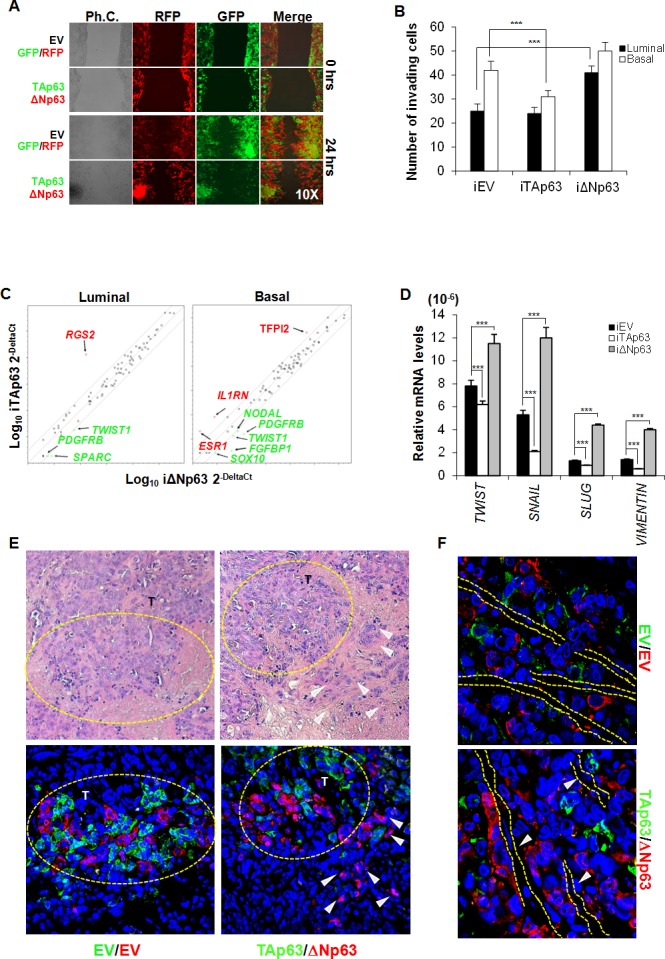
Figure 3. EMT program is regulated by ΔNp63 expression.

A. Representative wound healing analysis of 3 independent experiments performed with 3 luminal BCSCs over-expressing TAp63-GFP (green color) or ΔNp63-RFP (red color). Cell migration was monitored for 24 h. B. Invasion assay performed at 72 hours with luminal and basal iEV, iTAp63 or iΔNp63 BCSCs following 5 days of exposure to doxycycline. Data are represented as mean ± S.D. of 3 independent experiments derived from 3 luminal and 2 basal BCSC lines. C. EMT-related gene expression analysis of luminal and basal iEV, iTAp63 or iΔNp63 BCSCs following 3 days of exposure to doxycycline. Fold variation of ΔNp63 vs TAp63 ≥ 3 are shown in green or red. D. TWIST, SNAIL, SLUG and VIMENTIN mRNA expression levels in luminal BCSCs as in C. Results show mean ± S.D. of 3 independent experiments. E. (Upper panels) Representative H&E staining performed on paraffin-embedded sections of xenografts generated by subcutaneous injection of 1:1 mixture of EV-GFP:EV-RFP or TAp63-GFP:ΔNp63-RFP luminal BCSCs. (Lower panels) Immunofluorescence analysis of TAp63-GFP (green color) or ΔNp63-RFP (red color) performed on paraffin-embedded sections of xenografts generated as in E Dashed yellow circles represent tumor growth areas (T). White arrowheads indicate tumor buds overexpressing ΔNp63-RFP (red color) at the tumor invasion front. F. Representative immunofluorescence analysis of TAp63-GFP (green color) or ΔNp63-RFP (red color) performed on paraffin-embedded sections of xenografts generated as in E White arrowheads and dashed lines indicate vessels. * indicates P < 0.05, ** indicate P < 0.01 and *** indicate P < 0.001. ns indicates non statistically significant.
