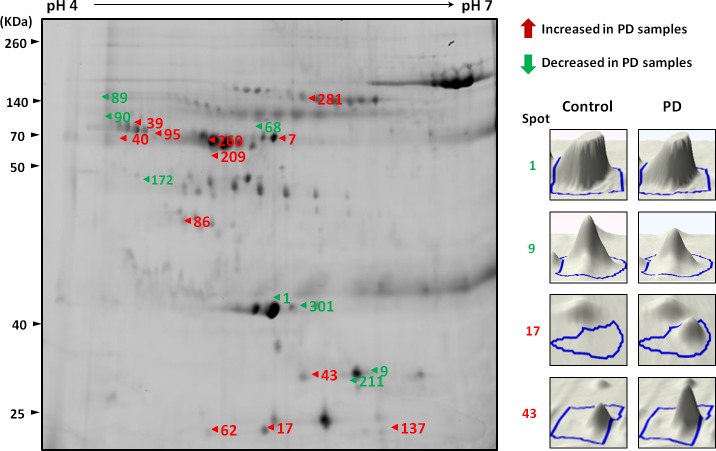
Figure 1. A representative composite two-dimensional difference gel electrophoresis of PD patients and healthy controls.
The arrows indicate the differentially expressed serum proteins in PD samples compared with healthy controls. The number in the gel corresponds to the master number presented in Table 1. The expression of proteins among serum samples from controls and PD patients were visualized by three-dimensional images (right panel).

