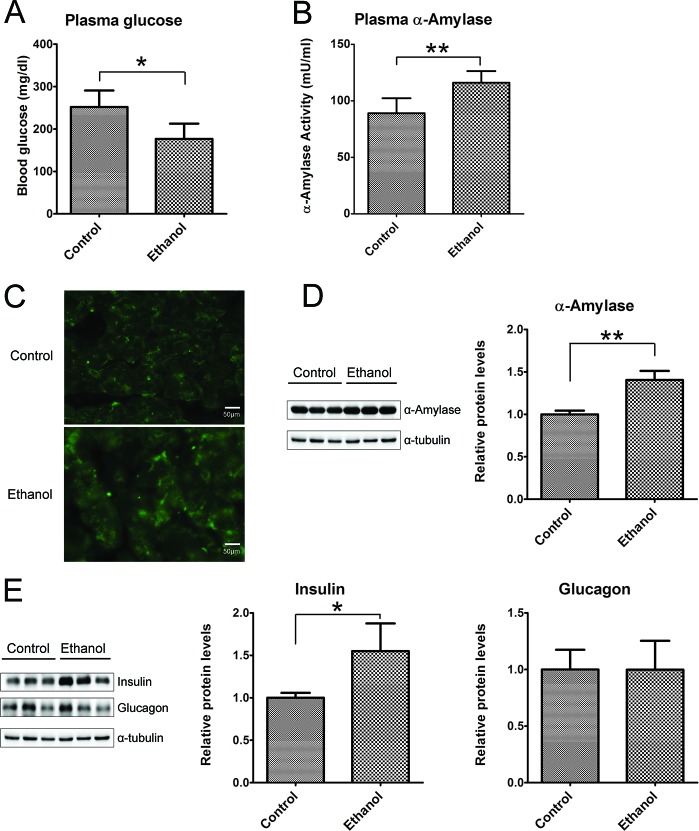
Figure 5. Effect of binge ethanol exposure on pancreatic function.
A. and B. the glucose and α-amylase levels in the plasma were determined as described in the Materials and Methods. C. The expression of α-amylase (green) in the pancreas was detected by immunofluorescent staining. Bar = 50 μm in the top panel (magnification of 40X). D. The expression of α-amylase in the pancreas was determined by immunoblotting analysis. E. The expression of insulin and glucagon in the pancreas was determined by immunoblotting analysis. Panels on the right show the quantification of the expression that was normalized to α-tubulin * denotes statistical difference (p < 0.05) and ** denotes significant difference (p < 0.01) from the control.

