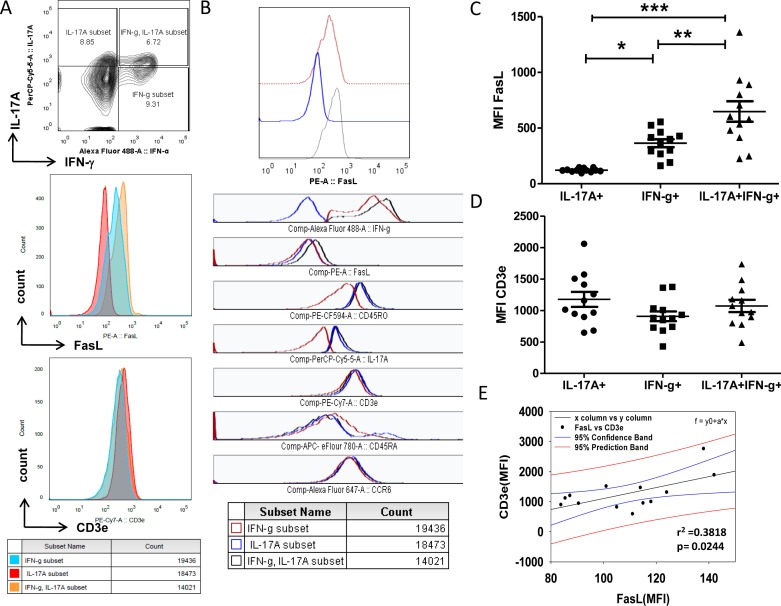
Figure 2. Differential expression of FasL in RA T helper cells.
A. FasL and CD3e expression in IL-17A+ or IFN-γ+ or double positive Th1/Th17 cells from human RA peripheral blood samples (n = 13). B. Differential FasL protein expression in RA T helper cells. C. Scatter plot with Mean ± SEM of Median Fluorescent Intensity of FasL protein in IL-17A+, IL-17A+/ IFN-γ+ and IFN-γ+ T cells of human RA blood samples (n = 13). D. Scatter plot with Mean ± SEM of CD3e protein expression in IL-17A+, IL-17A+/ IFN-γ+ and IFN-γ+ T cells of human RA blood samples (n = 13). Kruskal-Wallis test and Dunn's Multiple Comparison post hoc test were performed to find statistical significance using GraphPad prism and p < 0.5 was considered as significant. E. Non-linear regression analysis of FasL and CD3e proteins expression in RA CD4+ T cells using Sigma Plot (r = + 0.3818, p = 0.02, 95% CB) n = 13.

