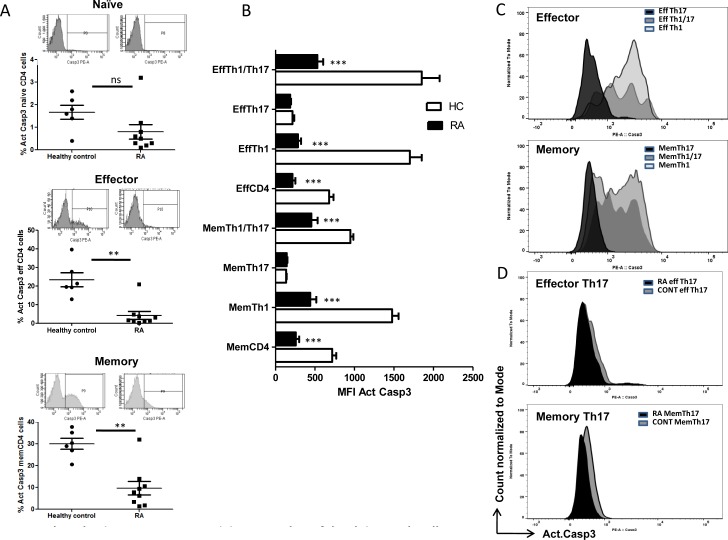
Figure 4. Active Caspase-3 as an index of AICD in Human RA and control T helper cells.
A. Scatter plot with Mean ± SEM of % Active Caspase3 and representative flow histogram of compartmental T cells from human RA and control. B. Mean ± SEM of MFI Active caspase3 in compartmental T helper cells from human RA (n = 9) and control (n = 6). C. A representative histogram overlay of Active caspase3 in Effector (upper) and Memory (lower) Th1, Th17 and Th1/Th17 cells from human control. D. A representative histogram overlay of Active caspase3 in Effector Th17 (upper) and Memory 17 (lower) cells from human RA (n = 9) and control (n = 6). Two-way ANOVA and Bonferroni posttests were performed to find statistical significance using GraphPad prism and p < 0.5 was considered as significant.

