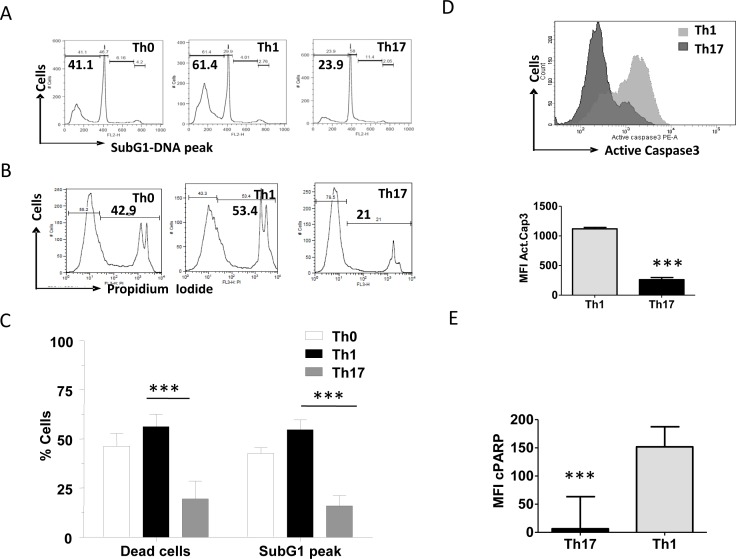
Figure 5. Characterization of differential AICD susceptibility in T helper cells.
A. Representative histogram of Sub G1 peaks (upper) and B. loss of viability (lower) in Th0, Th1 and Th17 cells after 16 hrs of anti-CD3 induced reactivation. C. Mean and SEM of percent SubG1 DNA and PI+ dead cells of T helper cells. D. Mean and SEM of Active Caspase3 (below) and representative histogram (above) of active Caspase3 during AICD of Th1 and Th17 cells. E. Mean and SEM of cleaved PARP during TCR-AICD of Th1 and Th17 cells. Data represent at least three independent experiments. Data was tested for significance by using one way ANOVA and Tukey's Multiple Comparison post hoc test and p < 0.5 considered as significant.

