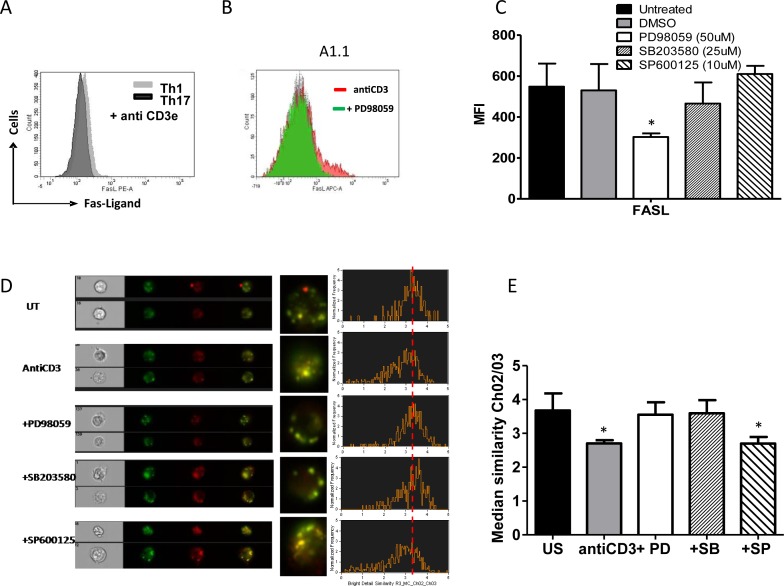
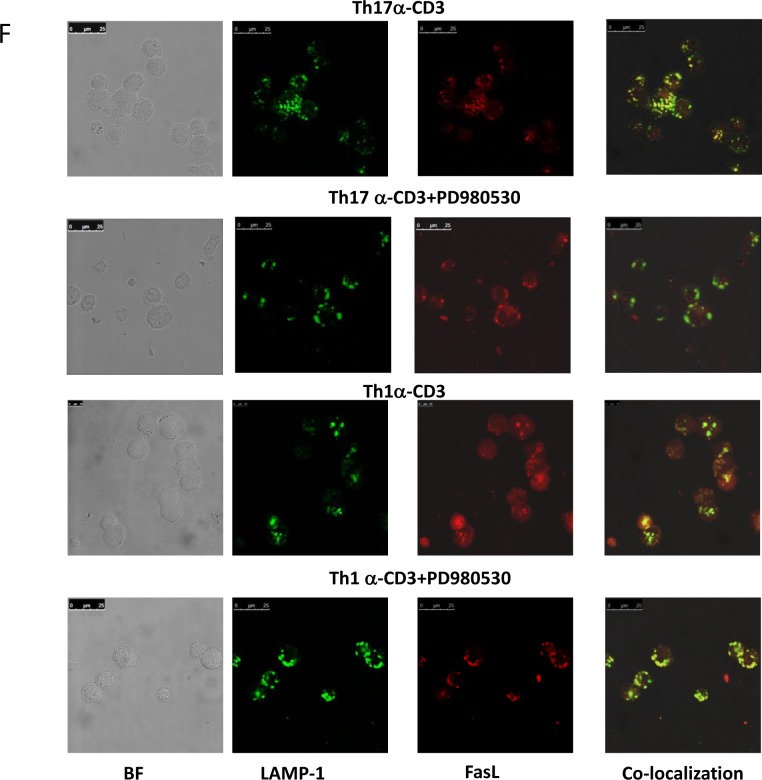
Figure 8. MAPK on FasL protein expression and degranulation in T helper cells.
A. Representative histogram overlay of FasL expression in Th1 (grey) and Th17 cells (black) after anti-CD3 stimulation for 10 hrs. B. Representative histogram overlay of FasL expression in A1.1 cells treated with antiCD3 alone (red) and antiCD3 + PD98059 (green). C. Mean and SEM of Total FasL expression (MFI) in Th1 like A1.1 cells treated with and without MAPK inhibitors such as PD98059 (50uM) for Erk1/2, SB203580 (25uM) for p38 and SP600125 (10uM) for JNK and after 10 hrs of anti-CD3 induced reactivation. D. A representative image and histogram of Imaging flow cytometry of FasL protein degranulation from lysosomal co-localization with LAMP-1 FITC (green) and FasL PE (red) in A1.1 cells treated with and without MAPK inhibitors such as PD98059 (50uM) SB203580 (25uM) and SP600125 (10uM) and after 10 hrs of anti-CD3 induced reactivation. E. Mean and SEM of median similarity of Ch02 (LAMP-1-FITC) and Ch03 (FasL PE) in similarly treated A1.1 cells. F. Representative confocal image of FasL protein degranulation from lysosomal co-localization with LAMP-1 FITC (green) and FasL PE (red) in Th1 and Th17 cells.


