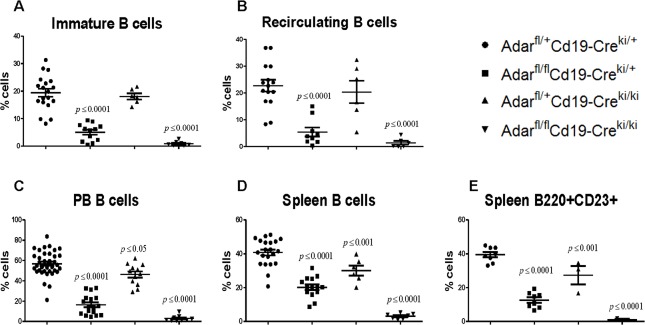
Figure 2. B lineage specific Adar ablation results in a profound deficiency of immature (naïve) and peripheral (mature) B cell deficiency.
Charts show the percentage of A. immature and B. MR B cells in the BMs from a large number of mutants and littermate control mice. C. Percentage of peripheral blood circulating B cells in the four indicated mice groups. Percentage of D. total B220+ and E. transitional T2/follicular CD23+ splenic B cells. Each point in the graphs represents the percentage of the specified B cell subset for an individual mouse. Mean values are represented with horizontal bars, and error bars represent ±SD. P values were determined by the one-way ANOVA test (compared against Adarfl/+Cd19-Creki/+ controls).

