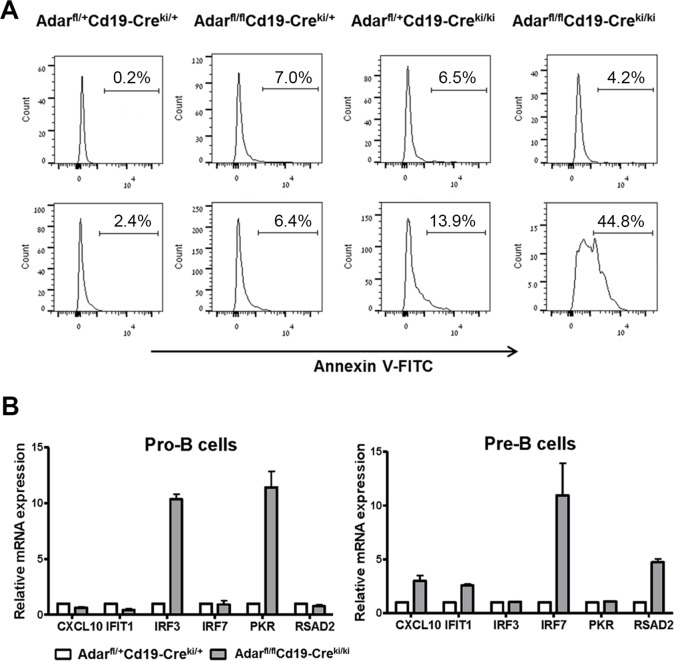
Figure 4. Cd19-Cre dependent disruption of Adar leads to apoptosis and type-I interferons response.
A. Histograms depict FACS analysis of Annexin V staining of pre-B cells (upper panel) and immature B cells (lower panel) following overnight in vitro incubation. C. Pro-B cells and pre-B cells were isolated from BMs by a FACSAria sorter, and total RNA was purified from the cells as detailed in Methods. Next, we measured by qRTPCR the relative mRNA expression of the indicated ISGs. Bar graphs depict mean of triplicates (± SD), as calculated by the ∆∆CT method, normalized to Gapdh gene expression. Data show a representative experiment out of three performed.

