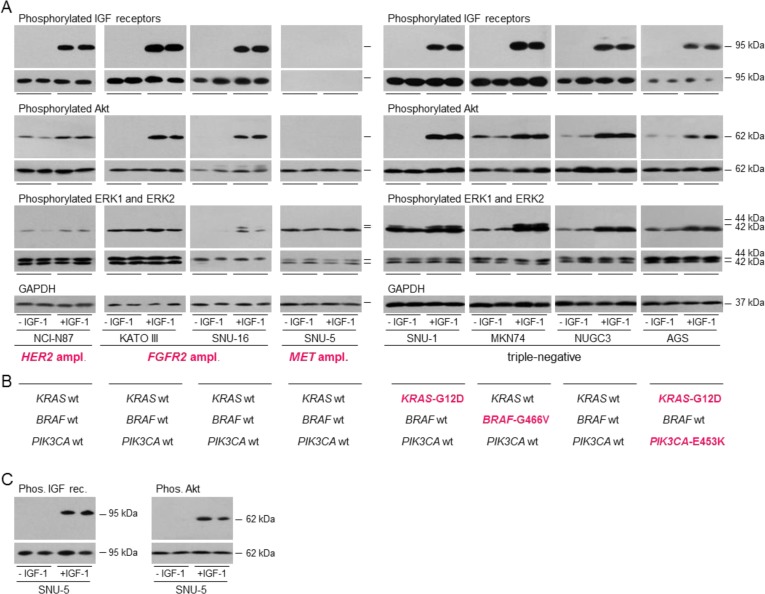
Figure 2. Activation of signal transduction pathways in gastric cancer cells.
NCI-N87, KATO III, SNU-16, SNU-5, SNU-1, MKN74, NUGC3 and AGS were withdrawn for one (SNU-1) or two days, stimulated with 50 ngml−1 IGF-1 for 15 min and lysed A. and C. Aliquots of 10 μg of protein were electrophoresed on polyacrylamide gels, transferred to nitrocellulose and incubated with antibodies against, phosphorylated IGF receptors, type I IGF receptor, phosphorylated Akt, pan Akt, phosphorylated ERK1 and ERK2, ERK1 and ERK2, or GAPDH and developed. Representative images from incubations with the same antibody concentrations and exposure times for each detection antibody are shown to allow comparison between cell lines. Images obtained after incubation with antibodies against the total individual proteins are beneath those of the corresponding phosphorylated proteins. Driver amplifications and mutations discussed in the text are shown in bold cerise B. For SNU-5, additional longer exposures after incubation with higher concentrations of the type I IGF receptor and phosphorylated IGF receptor antibodies and after incubation with the same concentration of phosphorylated Akt antibody and are shown C.

