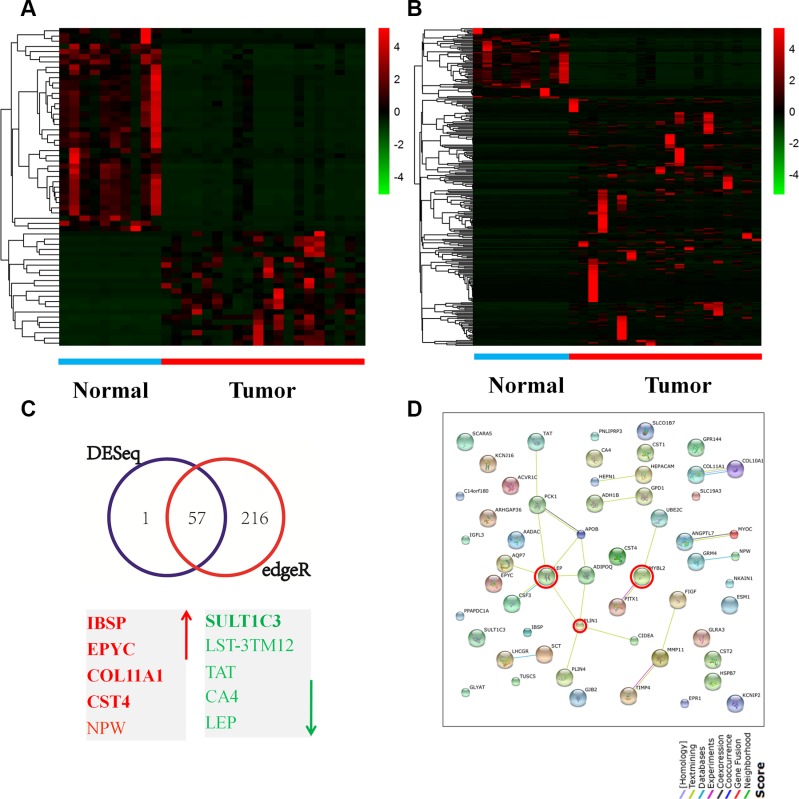
Figure 1. Gene expression patterns in breast cancer tissues.
(A–B) A heatmap illustrating genes expression profiles for the 30 breast cancer cases (10 normal and 20 tumors). The log2 values were calculated for each sample by normalizing to read counts alone (log2Fold Change). Heatmap analysis was performed by R version 3.2.2 software with DESeq package (p < 0.05 and log2 Fold Change > 4) (A) and edgeR package (p < 0.05 and log2 Fold Change > 4) (B). Short red and green vertical bars indicate upregulated and downregulated genes, respectively. RNAseq data were downloaded from TCGA database. (C) A Venn diagram of the concordant gene entities by the two algorithms and the top 10 genes, of which 5 were upregulated (red) and 5 were downregulated (green). (D) Analysis for protein-protein interaction by the STRING network identified two major interconnecting clusters with high-degree interactions between the genes (N = 57); three nodes of connection were encircled.

