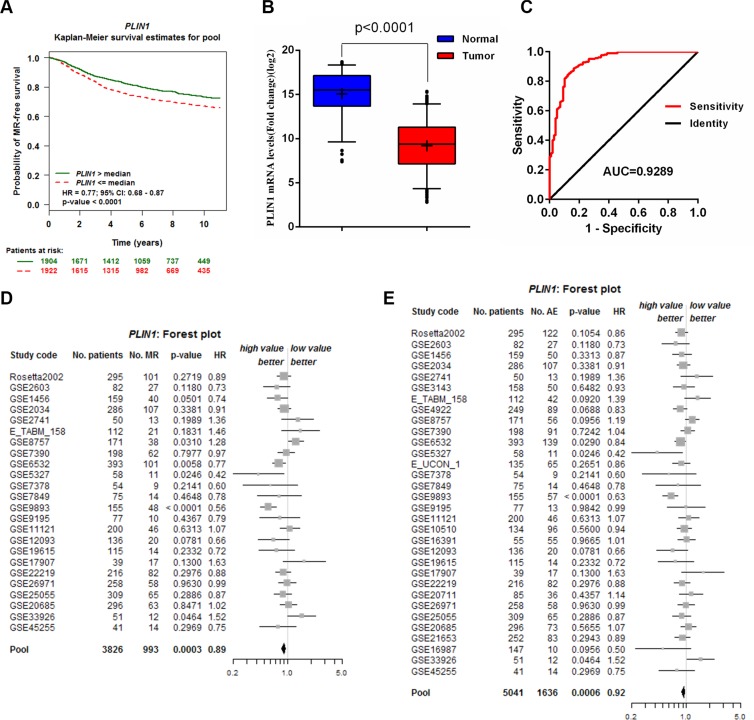
Figure 2. Validation of the PLIN1 gene signature for predicting survival.
(A) Kaplan-Meier MR-free overall survival curves using the Bc-GenExMiner v3.2 database (N = 3826). (B) PLIN1 mRNA expression was downregulated in 308 breast cancer samples downloaded from TCGA database. (C) ROC curve of PLIN1 expression in breast cancer patients from normal subjects. The area under the curve (AUC) was 0.93, with a standard error of 0.02 and a 95% confidence interval of 0.89–0.96. (D–E) Forest plots of PLIN1 expression on MR-free (D) and AE-free (E) survival.

